What’s going on with VMware Transparent Page Sharing?


What is Transparent Page Sharing?

When multiple virtual machines are running, some of them may have identical sets of memory content. This presents opportunities for sharing memory across virtual machines (as well as sharing within a single virtual machine). For example, several virtual machines may be running the same guest operating system, have the same applications, or contain the same user data. With page sharing, the hypervisor can reclaim the redundant copies and keep only one copy, which is shared by multiple virtual machines in the host physical memory. As a result, the total virtual machine host memory consumption is reduced and a higher level of memory overcommitment is possible.

What is the security problem related to Transparent Page Sharing currently?

There has been recent academic research that leverages Transparent Page Sharing (TPS) to gain unauthorized access to data under certain highly controlled conditions and documents VMware’s precautionary measure of restricting TPS to individual virtual machines by default in upcoming ESXi releases. At this time, VMware believes that the published information disclosure due to TPS between virtual machines is impractical in a real world deployment.

Published academic papers have demonstrated that by forcing a flush and reload of cache memory, it is possible to measure memory timings to try and determine an AES encryption key in use on another virtual machine running on the same physical processor of the host server if Transparent Page Sharing is enabled between the two virtual machines. This technique works only in a highly controlled system configured in a non-standard way that VMware believes would not be recreated in a production environment. .

Even though VMware believes information being disclosed in real world conditions is unrealistic, out of an abundance of caution upcoming ESXi Update releases will no longer enable TPS between Virtual Machines by default (Inter-VM TPS). TPS will still be utilized within individual VMs. (Intra-VM TPS)

What is meant by Intra-VM and Inter-VM in the context of Transparent Page Sharing?

  • Intra-VM means that TPS will de-duplicate identical pages of memory within a virtual machine, but will not share the pages with any other virtual machines.
  • Inter-VM mean that TPS will de-duplicate identical pages of memory within a virtual machine and will also share the duplicates with one of more other virtual machines with the same content.

VMware will disable the ability to share memory pages “between” virtual machines (Inter-VM Transparent Page Sharing) by default (in ESXi 5.0/5.1 and 5.5) in coming updates and the next major ESXi release and inter-Virtual Machine TPS is not enabled by default as of ESXi 6.0. Administrators may revert to the previous behavior if they so wish.

What could potentially be the effect?

Disabling inter-Virtual Machine TPS may impact performance in environments that rely heavily on memory over-commitment although we still have memory resource management techniques such as

  • Ballooning – Reclaims memory by artificially increasing the memory pressure inside the guest
  • Hypervisor/Host swapping – Reclaims memory by having ESX directly swap out the virtual machine’s memory
  • Memory Compression – Reclaims memory by compressing the pages that need to be swapped out

Please keep reading KB52337 for further information

So what options do we have?

The concept of salting has been introduced to help address concerns system administrators may have over the security implications of TPS. Salting is used to allow more granular management of the virtual machines participating in TPS than was previously possible. As per the original TPS implementation, multiple virtual machines could share pages when the contents of the pages were same. With the new salting settings, the virtual machines can share pages only if the salt value and contents of the pages are identical. A new host config option Mem.ShareForceSalting is introduced to enable or disable salting.

By default, salting is enabled after the ESXi update releases mentioned above are deployed, (Mem.ShareForceSalting=2) and each virtual machine has a different salt. This means page sharing does not occur across the virtual machines (inter-VM TPS) and only happens inside a virtual machine (intra VM).

When salting is enabled (Mem.ShareForceSalting=1 or 2) in order to share a page between two virtual machines both salt and the content of the page must be same. A salt value is a configurable vmx option for each virtual machine. You can manually specify the salt values in the virtual machine’s vmx file with the new vmx option sched.mem.pshare.salt. If this option is not present in the virtual machine’s vmx file, then the value of vc.uuid vmx option is taken as the default value. Since the vc.uuid is unique to each virtual machine, by default TPS happens only among the pages belonging to a particular virtual machine (Intra-VM).
If a group of virtual machines are considered trustworthy, it is possible to share pages among them by setting a common salt value for all those virtual machines (inter-VM).

The following table shows how different settings for TPS are used together to affect how TPS operates for individual virtual machines: 

What is the default behavior of Transparent Page Sharing in above mentioned Update releases?

By default, the setting is (Mem.ShareForceSalting=2) and each virtual machine has a different salt (that is sched.mem.pshare.salt is not present) which means that only Intra-VM page sharing is enabled. This behavior is new as per these ESXi update releases and page sharing will not happen across the virtual machines (inter-VM TPS) by default. 

How can I enable or disable salting? 

  1. Log in to ESX (i)/vCenter with the VI-Client.
  2. Select ESX (i) relevant host.
  3. In the Configuration tab, click Advanced Settings (link) under the software section.
  4. In the Advanced Settings window, click Mem.
  5. Search for Mem.ShareForceSalting and set the value to 1 or 2 (enable salting), 0 (disable salting).
  6. Click OK.
  7. For the changes to take effect do either of the two:
    • Migrate all the virtual machines to another host in cluster and then back to original host. Or
    • Shutdown and power-on the virtual machines.

How can I allow inter-VM TPS between two or more virtual machines?

Inter-VM TPS is enabled for two or more virtual machines by enabling salting and by giving them the same salt value.

How can I specify salt value of a virtual machine?

  1. Power off the virtual machine on which you want to set salt value.
  2. Right click on virtual machine, click on Edit settings.
  3. Select options menu, click on General under Advanced section.
  4. Click on Configuration Parameters
  5. Click on Add Row, new row will be added.
  6. On LHS add text sched.mem.pshare.salt and on RHS specify the unique string.
  7. Power on the virtual machine to take effect of salting.
  8. Repeat steps 1 to 7 to set the salt value for individuals virtual machine.

What is the difference in behavior of page sharing when MEM_SHARE_FORCE_SALTING value is set to 1 and 2?

MEM_SHARE_FORCE_SALTING 1: By default salt value is taken from sched.mem.pshare.salt. If not specified, falls back to old TPS (inter-VM) behavior by considering salt values for the virtual machine as 0.

MEM_SHARE_FORCE_SALTING 2: By default salt value is taken from vc.uuidz. If it does not exist, then the page sharing algorithm generates random and unique value for salting per virtual machine, which is not configurable by users.

How can I prepare for the ESXi Update releases that no longer allow inter-VM TPS by default?

VMware recommends you to monitor free memory available on the host along with the total ballooned and total swapped memory before deploying the ESXi update releases listed above that disallow inter-VM TPS. Once inter-VM TPS is disallowed, available free memory might drop which further can lead to increased ballooning and swapping. If increased ballooning and swapping activity is observed along with noticeable performance issues, more physical memory can be added on the host or the memory load on the host can be reduced.
To monitor the stats – Run esxtop command:

  • Run esxtop on host, click to switch to memory mode.
  • free from PMEM /MB row displays the free memory available on the host.
  • curr from MEMCTL/MB row displays the total ballooned memory.
  • curr from SWAP/MB row displays the total swapped memory.

How can I enable or disable salting for multiple ESXi hosts?

To enable or disable salting for multiple ESXi hosts. Refer to the attached powercli script in KB2097593

. This script allows toggling pshare salting for update releases.

Usage

.\pshare-salting.ps1 <vcenter IP/hostname> -s -> Enables pshare salting.
.\pshare-salting.ps1 <vcenter IP/hostname> -o -> Turn offs pshare salting and falls back to default TPS behaviour

Links

KB2080735

KB2097593

Are there any tools we are able to use to compare TPS savings before and after disabling Inter-VM transparent page sharing?

There is a PowerShell script (VMware recommended) called the “Host Memory Assessment Tool” to look at shared memory per host, and report it in a tabular form, so you can easily review the current shared memory savings, and the worst case impact in contrast with the free memory on the host. The script uses plink.exe to remotely SSH into each ESXi host and record memory counters using vsish. There is very low risk and impact to the ESXi hosts as it is a read only process

https://www.brianjgraf.com/2015/04/03/assess-impact-tps-vsphere-6/
What the script does:

  • Connects to vCenter and enumerates all ESXi hosts
  • Allows you to enable SSH on selected hosts
  • Generates an assessment report
  • Allows you to export the assessment report to .csv
  • Allows you to easily turn off SSH again if necessary

This tool would need to be run on an normal existing system with workloads with TPS on and Off to see the different outputs.

https://www.brianjgraf.com/2015/04/03/assess-impact-tps-vsphere-6/
VMware Update (20/03/2018)

The last update and updates going forward on performance impact associated with applying the security patches are now found in https://kb.vmware.com/s/article/52337

Virtualization Layer Mitigations: The latest ESXi patches** and the relevant Intel CPU microcode but without Guest Operating System mitigation patches. These mitigations have a minimal performance impact (< 2%) for most workloads on a representative range of recent Intel Xeon server processors.

Full Stack Mitigations: All levels of mitigation. This includes all virtualization layer mitigations above with the addition of Guest Operating System mitigation patches. As reported in the press, the impact of these mitigations will vary depending on your application. Applications with very heavy system call usage, including those with very high IO rates, will show a more significant impact than their counterparts with lower system call usage. For information regarding the performance impact of Operating System Mitigations on your application, please consult with your Operating system and/or Application vendor. Consistent with our findings above, the virtualization layer mitigations that are part of these full stack mitigations have minimal influence to the overall impact. As a general best practice, we recommend you test the appropriate patches with your applications prior to deploying in production environments.

Recap on Cluster Admission Control in vSphere 6.5/6.5U1


Cluster Admission Control in vSphere 6.5/6.5U1

vSphere HA uses admission control to ensure that sufficient resources are reserved for virtual machine recovery when a host fails. The basis for vSphere HA admission control is how many host failures your cluster is allowed to tolerate and still guarantee failover for the VMs on to the remaining hosts. The default Admission Control policy has changed from Slot Policy (Default until 6.5), to ‘Cluster Resource Percentage’. VMware had found that very few people were actually using slot policy, and those that were, were not using it correctly and it also involved some manual calculations when hosts were added or removed.

Admission control imposes constraints on resource usage. Any action that might violate these constraints is not permitted. Actions that might be disallowed include the following examples:

  • Powering on a virtual machine
  • Migrating a virtual machine
  • Increasing the CPU or memory reservation of a virtual machine

Computing the Current Failover Capacity

The total resource requirements for the powered-on virtual machines is comprised of two components, CPU and memory. vSphere HA calculates these values.

  • The CPU component by summing the CPU reservations of the powered-on virtual machines. If you have not specified a CPU reservation for a virtual machine, it is assigned a default value of 32MHz (this value can be changed using the das.vmcpuminmhz advanced option.)
  • The memory component by summing the memory reservation (plus memory overhead) of each powered-on virtual machine.

The total host resources available for virtual machines is calculated by adding the hosts’ CPU and memory resources. These amounts are those contained in the host’s root resource pool, not the total physical resources of the host. Resources being used for virtualization purposes are not included. Only hosts that are connected, not in maintenance mode, and have no vSphere HA errors are considered.

The Current CPU Failover Capacity is computed by subtracting the total CPU resource requirements from the total host CPU resources and dividing the result by the total host CPU resources.

The Current Memory Failover Capacity is computed by subtracting the total Memory resource requirements from the total host memory resources and dividing the result by the total host Memory resources

Host Failure Cluster Tolerates 

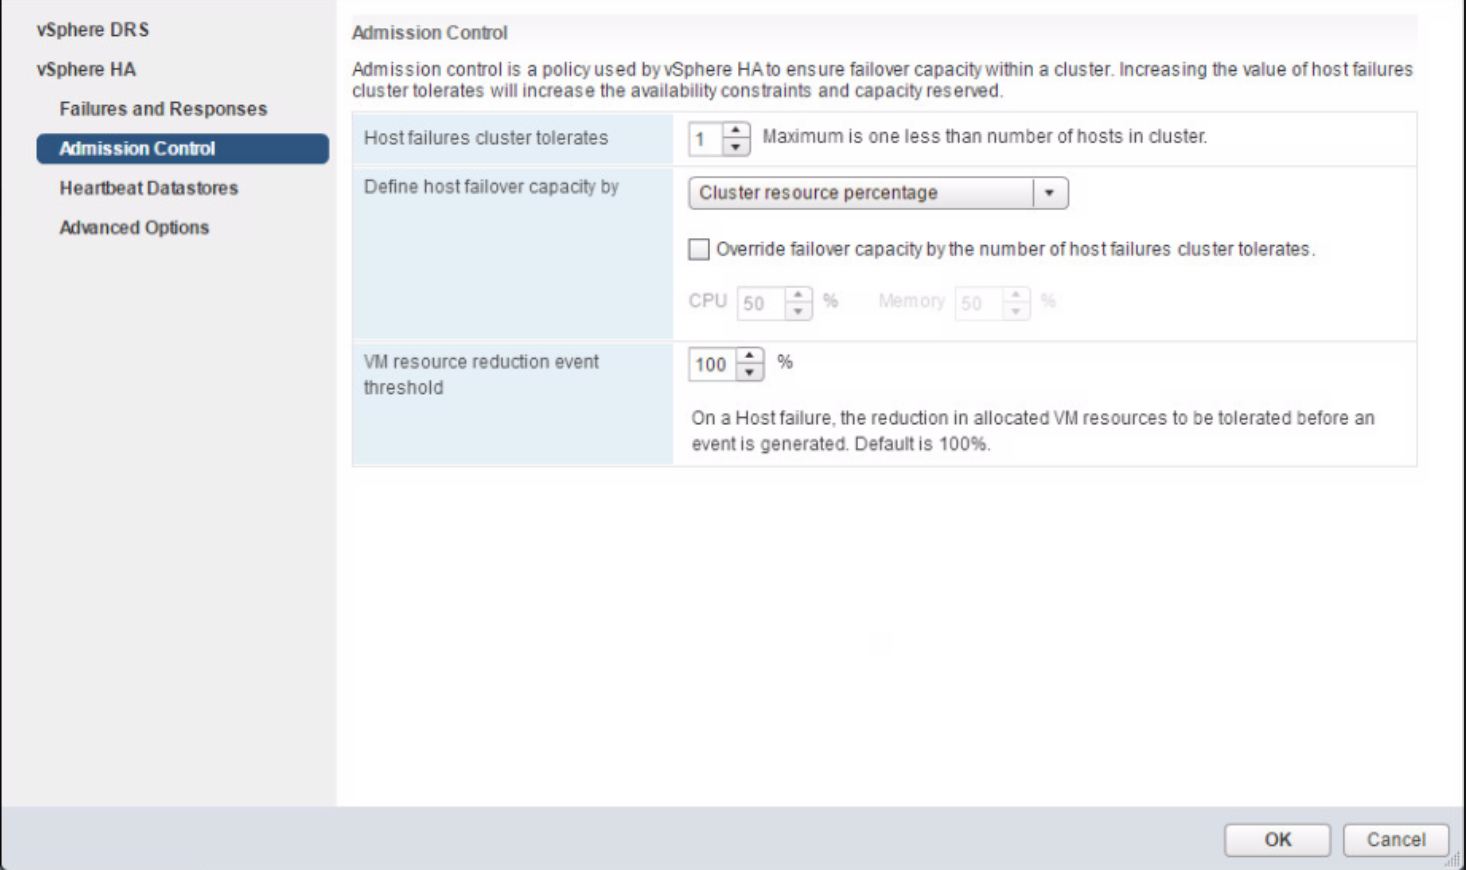
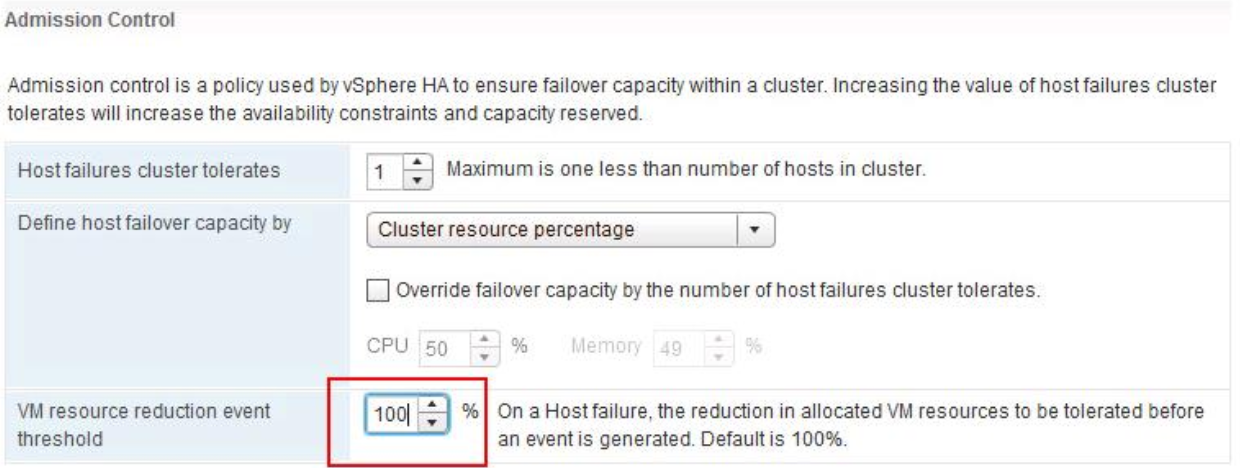
This option allows you to define the number of ESXi hosts tolerate for failures. vSphere HA will automatically calculate a percentage of resources to set by applying the “Percentage of Cluster Resources” (Default option in vSphere 6.5) admission control policy. Resources required for failover capacity is now directly related to the Host failures cluster tolerates option. In the example below, there are 2 ESXi hosts in the cluster and I have configured “Host failures cluster tolerates” value as “1”. HA will then automatically reserve 50% of Memory and 50% of CPU for the failover capacity. If you have a 4-host cluster and FTT=1 then it will calculate a 25% reservation. HA Slot policy used to be the default admission control policy. With vSphere 6.5, the default admission control policy is now “Cluster resource Percentage”.

If you have add or remove ESXi hosts in the cluster, the percentage of failover capacity will be automatically recalculated.

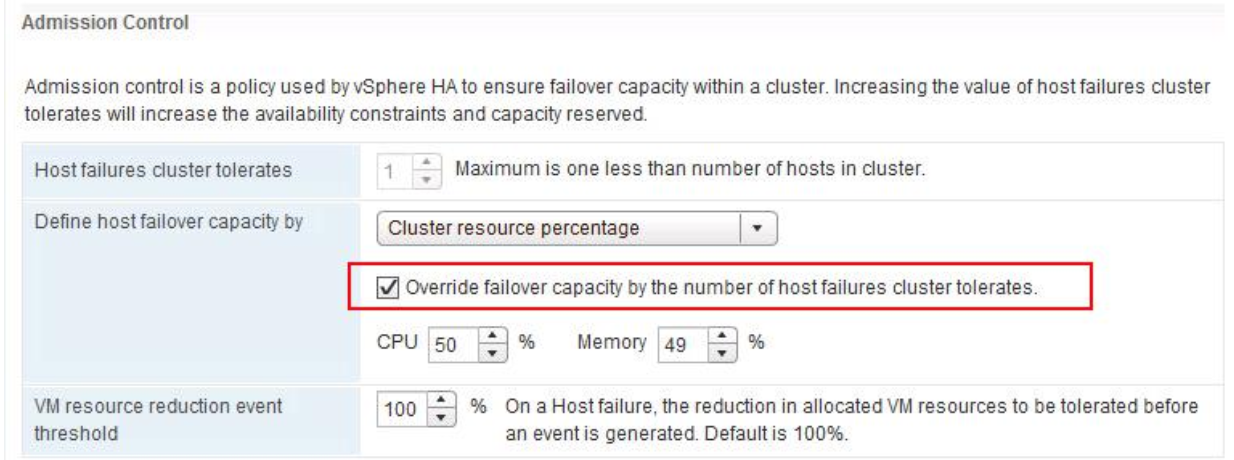
You have the option to Override the failover capacity by the number of host failures cluster tolerates by selecting the Override option and specify % for CPU and Memory.


Define host failover capacity by HA Slot Policy

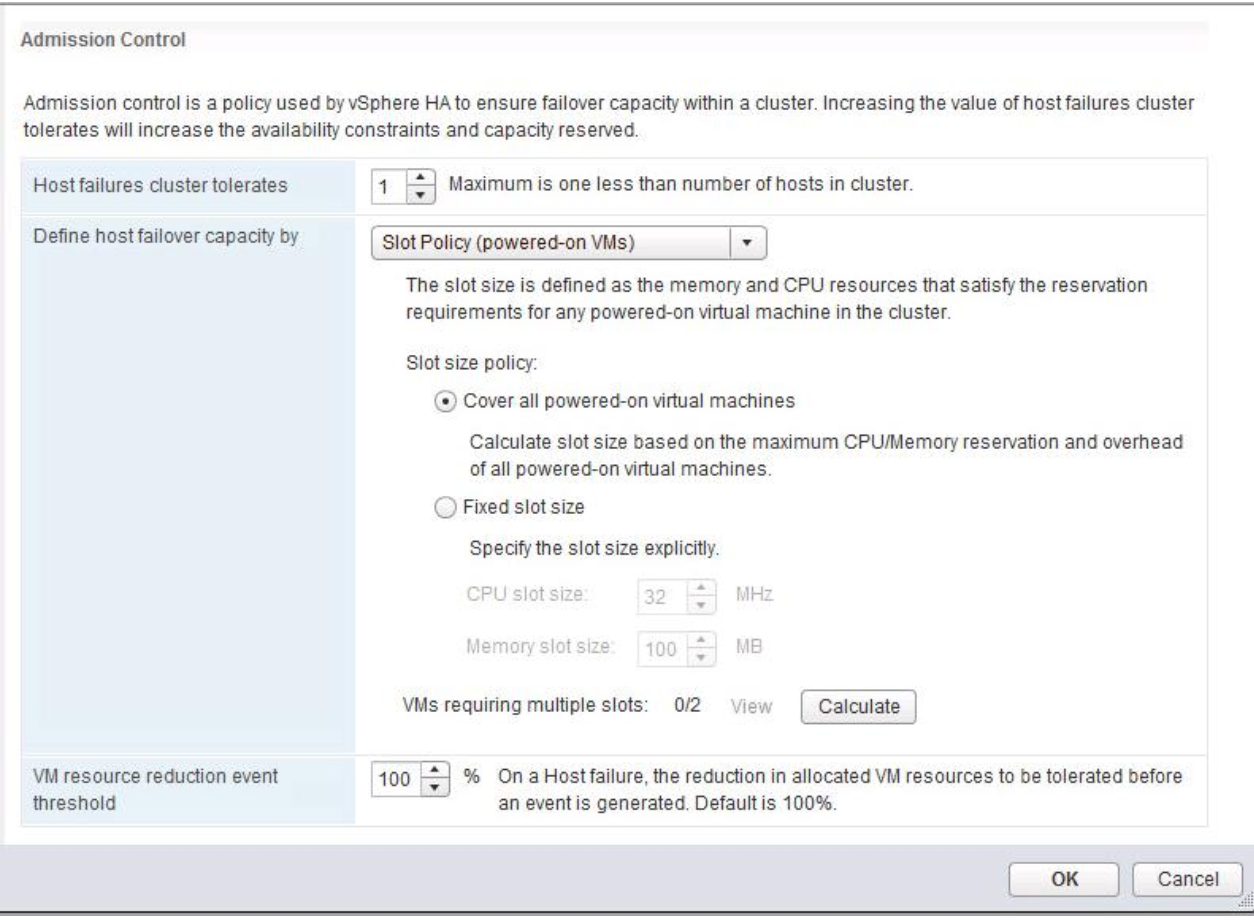
You can also have option to choose “Slot Policy”.  This is the default option prior to vSphere 6.5. Slot Size is defined as the memory and CPU resources that satisfy the reservation requirements for any powered-on virtual machines in the HA cluster. You have 2 options under Slot Policy:

  • Cover All powered-on Virtual Machines

It calculates the slot size based on the maximum CPU/Memory reservation and overhead of all powered-on virtual machines in the cluster but will be skewed by reservations on VMs which is why we have the setting below to override calculations being based on large reservations.

  • Fixed Slot Size

You can explicitly specify the fixed slot size


Define host failover capacity by Dedicated Failover Hosts

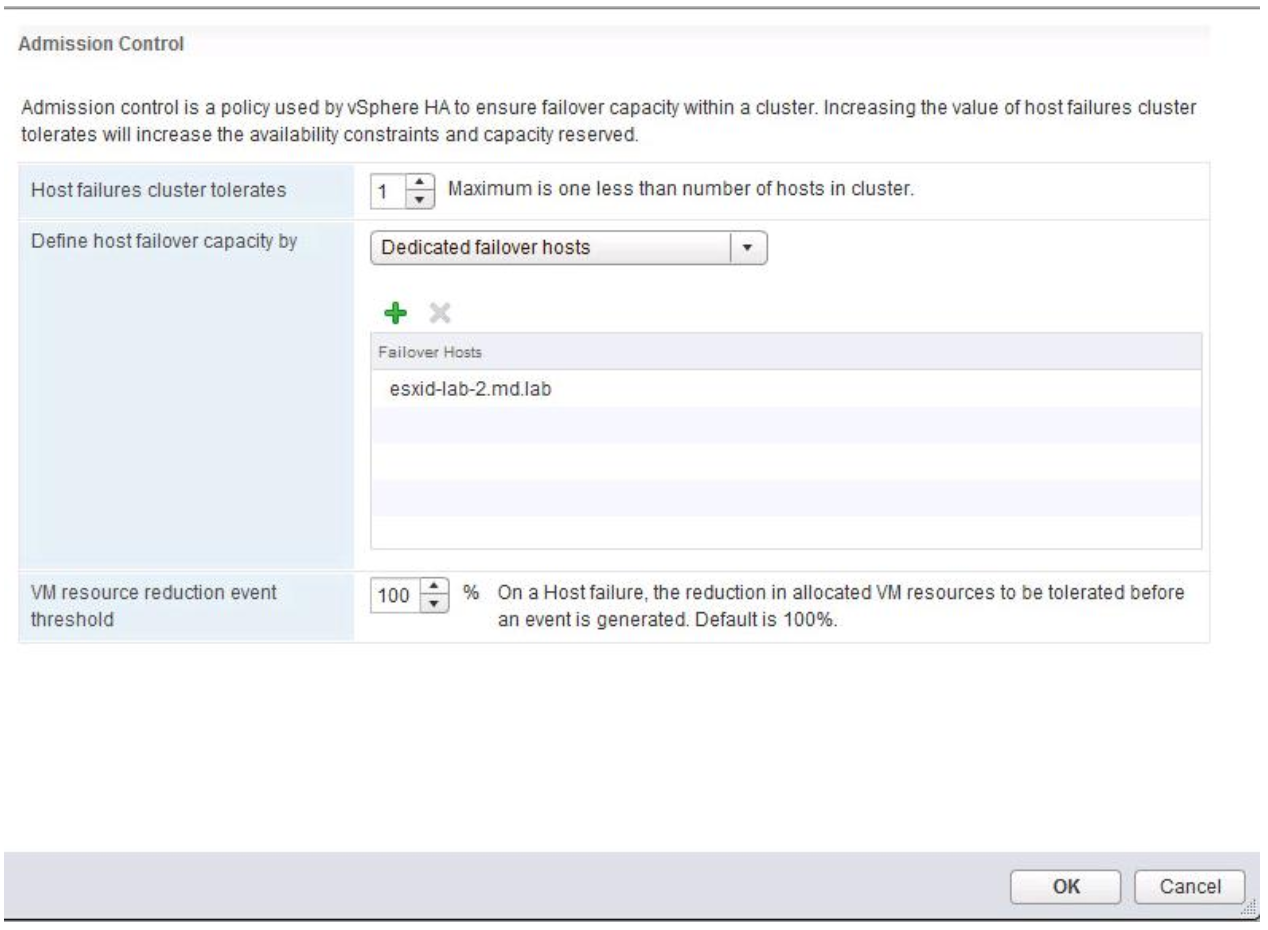
This option allows you to define a dedicated ESXi host in the cluster as failover hosts for the HA cluster.  That dedicated failover host will not run virtual machines unless vSphere HA needs to recover from a failed host. However this is a waste of a whole host and not generally used unless you have the ability and capacity in your datacenter to keep a spare host aside just in case.


VM resource reduction event threshold – Performance Degradation Tolerance

The reserved capacity used by admission control ensures that all configured reservations will continue to be honored after a host failure.  If the reservations are not used in some environments, the performance of the cluster could be impacted.  This new setting called “VM resource reduction event threshold” defines how much of a performance impact is tolerated and will issue a warning if the consumed resources are higher than the reserved resources.

0% – Raises a warning if there is insufficient failover capacity to guarantee the same performance after VM’s restart.

100% -Warning is disabled.


Example

400GB of memory available in a 4 node cluster
1 host failure to tolerate specifed
310GB of memory actively used by VMs
0% resource reduction tolerated

This results in the following:
400GB – 100GB (1 host worth of memory) = 300GB
We have 310GB of memory actively used, with 0% resource reduction to tolerate
310GB needed, 300GB available after failure > A warning will be issued.

Summary

Just some general points I’ve seen lately. I’ll update them if anything else comes up which is interesting.

  • In terms of larger VMs skewing the options, any CPU or Memory VM reservation will be taken into account including the defaults taken for any VMs which do not have reservations.
  • In regards to reservations, they will only come into play when the system is under contention anyway. VMware is very good at managing resources. However if you do want to use them, I would advise monitoring the peak usage of CPU and RAM of the VMs you want a reservation on first so you can assign an accurate reservation.
  • Slot Policy is no longer the default option and is easy to set incorrectly so be careful with this option. You can create extra work for yourself but it is useful.
  • Use the Host failures to tolerate policy (the recommended policy now)
  • It may be worth setting the VM resource reduction event threshold so you are warned of any potential performance problems. Setting it to 0% will generate a warning if Admission Control thinks there is insufficient failover capacity to ensure the same performance after VMs are failed over. This is achieved through monitoring of actual usage of CPU and RAM resources. In conjunction with the Host Failures to Tolerate policy which just calculates using reservations, default cpu/ram values and overhead for its calculations, these 2 settings combined give a very useful monitoring aspect for your cluster.

The future of Mobile Technology in the UK

The Future of 4G Mobile Technology in the UK

What is 4G?

Mobile telephony has developed through several generations. The first generation (1G) was analogue, allowed for voice data only and used frequency-division multiple access.

The second generation (2G) is known as GSM. (Global System for Mobile). It was digital and initially focused on voice. GSM was a standard developed in the 1980s by the Conference of European Postal and Telecommunications Administrations.

The third generation (3G) system used in the UK is digital and called the Universal Mobile Telecommunications system (UMTS) also known as IMT-2000 (International Mobile Telecommunications). It was designed for voice and data and produced in the 1990s by the International Telecommunications Union (ITU).

The fourth generation (4G) is part of a project by the 3rd Generation Partnership  Project (3GPP) to further develop UMTS. The 3GGP issued releases which updated and enhanced UMTS. Releases 7 and 8 are known at Long Term Evolution (LTE) for UMTS. It is an IP based system

By 2010 the ITU had reached a finalised version of the IMT-Advanced standard introduced in Release 10. This included two technologies called LTE Advanced and WiMAX 2.0. “These were classed as 4G technologies where LTE has also been accepted as being and is referred to as 4G technology.” (The Open University, 2017)1

Differences between 4G and HSPA

HSPA (High Speed Packet Access) is a widely deployed and widely popular mobile broadband technology within the GSM family of technologies. HSPA encompasses both HSDPA (3GPP Release 5) and HSUPA (3GPP Release 6) technologies, when they are deployed on a network.

4G incorporates of a number of techniques and technologies that build and improve on earlier network standards like HSPA. The main differences between 4G and HSPA are below.

  • HSPA covers releases 5 and 6 of the UMTS standard. 4G comes under releases 7 to 14 currently.
  • HSPA can be informally classed as 3.5G technology rather than 4G.
  • HSPA is a digital system where as 4G is an IP-based system.
  • HSPA has a maximum downlink speed of 14.4Mb/s and a maximum uplink speed of 5.7Mb/s. 4G has a maximum of 1Gb/s downlink speed and a maximum uplink speed of 500Mbs with LTE-Advanced moving towards 3 Gbit/s downlink and 1.5 Gbit/s uplink.
  • 4G requires a complete redesign and simplification of 3G network architecture. Building a 4G network requires a completely new environment.
  • 4G has a lower latency than HSPA and better quality of service. 4G has a round trip time of around 10ms however HSPA is less than 100ms.
  • HSPA builds upon third generation UMTS/WCDMA technology with IMS (IP Multimedia System) and MBMS (Multimedia broadcast and multicast services) however, 4G uses OFDMA (orthogonal frequency-division multiple access) along with MIMO (multiple-input multiple-output).
  • HSPA uses scheduled shared channel transmission and channel dependent scheduling where capacity gains are obtained by transmitting to users with less busy radio-link conditions. This is known as multi-user diversity. 4G increases capacity by using time-division multiplexing technology on OFDMA to allow different users to share blocks of 12 channels.

Some technical details about 4G

The IMT-Advanced Standard was finalized in 2010 by the ITU. Two technologies are compatible with IMT-Advanced, and are therefore 4G technologies. One is LTE Advanced and the other Mobile WiMAX 2.0.

  • LTE Advanced

LTE Advanced was introduced in the 3GPP’s Release 10. The 3GPP Group have advised of the following features.

  1. Peak downlink speeds of 1 Gbp/s and uplink  500 Mbps.
  2. Three times greater spectrum efficiency than LTE with a peak spectrum efficiency downlink of 30 bps/Hz and uplink of 15 bps/Hz.
  3. Scalable bandwidth use and spectrum aggregation where non-contiguous spectrum needs to be used. This enables an increase in peak user data rates and overall capacity of networks by aggregating the bandwidth of component carriers.
  4. 5ms or less of latency
  5. Cell edge user throughput to be twice that of LTE.
  6. Average user throughput to be 3 times that of LTE.
  7. Mobility the same as LTE
  8. Backward compatible with legacy systems

The technologies used in LTE-Advanced to enable these features are as follows

  1. OFDMA (orthogonal frequency-division multiple access). The frequency band is split into a large number of closely spaced carriers called sub-carriers. Users are allocated to a number of channels and then a number of sub-carriers spaced at 15kHz. The downlink will use OFDMA and the uplink will use SC-FDMA. (Single channel frequency-division multiplex access)
  2. MIMO (multiple-input multiple-output) By using multiple antennas at the transmitter and receiver, MIMO  enables the system to set up multiple data streams on the same channel, increasing the data capacity of a channel
  3. Relay Nodes are low power base stations that provide enhanced coverage and capacity at cell edges, and hot-spot areas.
  4. Coordinated Multipoint is used to improve poor performance at the cell edges.
  5. Device to Device (D2D) is a peer to peer link which allows devices to communicate directly with one another in close proximity

WiMAX 

WiMAX stand for Worldwide Interoperability for Microwave Access. WiMAX technology is a broadband wireless data communications technology based around the IEE 802.16 standard providing high speed data over a wide area (up to 50 km) between fixed sites. IEEE 802.16m is now described as a 4G technology, as well as IEEE 802.16m. IEEE 802.16m is IP-based and packet-switched and is an alternative to wire technologies (Cable Modems, DSL and T1/E1 links) 802.16m can provide data rates up to 100 Mbps and the cell radius distances are typically between 20 and 30 miles.

The technologies used for WiMAX are

  • OFDM (Orthogonal Frequency Division Multiplex). IEEE 802.16m uses more closely spaced subcarriers than LTE Advanced. “In addition, whereas IEEE 802.16m uses OFDMA in both the uplink and the downlink, LTE Advanced, like LTE, uses it only in the downlink.” (Open University, 2017)2
  • MIMO (Multiple Input Multiple Output):   WiMAX makes use of multipath propagation using MIMO. By utilising the multiple signal paths that exist, the use of MIMO either enables operation with lower signal strength levels, or it allows for higher data rates

An update on 4G in the UK

The framework of standards for International Mobile Telecommunications (IMT), encompassing IMT-2000 and IMT-Advanced covering 3G and 4G technologies will continue to evolve as 5G with IMT-2020, a programme to develop “IMT for 2020 and beyond” by the ITU-R (International Telecommunication Union for Radio)

A draft new report is expected to be finally approved by the ITU-R Study Group 5 at its meeting in November 2017.  “The next step is to agree on what will be the detailed specifications for IMT-2020, a standard that will underpin the next generations of mobile broadband and IoT connectivity,” said François Rancy, Director of ITU’s Radiocommunication Bureau.” (ITU, 2017)1

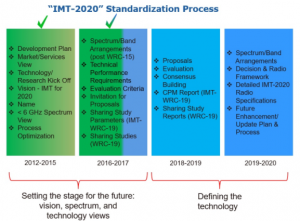
Figure 1 (ITU, 2017)2

Conclusion

The ITU has been continually developing the mobile communicating standards, specifications and features for 30 years. IMT2020/5G looks set to provide an enhanced service providing better coverage, lower outage probability, higher versatility and scalability, higher peak downlink and uplink speeds, higher spectral efficiency and the support of new trends such as IoT (Internet of Things). The technologies are still being defined but it looks like great improvements will be made to support the growing network of devices worldwide.

References

The Open University (2017)1, ‘4G’, T215 Block 2 Part 6 Convergence and 4G [online]. Available at: https://learn2.open.ac.uk/mod/oucontent/view.php?id=1102783&section=4. (Accessed 1 December 2017)

The Open University (2017)2  ‘Mobile WiMAX’ [online]. Available at: https://learn2.open.ac.uk/mod/oucontent/view.php?id=1102783&section=4. (Accessed 1 December 2017)

ITU (2017)1, ‘ITU agrees on key 5G performance requirements for IMT-2020’ [online]. Available at: http://www.itu.int/en/mediacentre/Pages/2017-PR04.aspx [Accessed 3 December 2017]

ITU (2017)2“IMT-2020” Standardization Process [online]. Available at: http://www.itu.int/en/mediacentre/Pages/2017-PR04.aspx [Accessed 3 December 2017].

VMware Ruby Virtual Console for vSAN 6.6

VMware Ruby Virtual Console for vSAN 6.6

The Ruby vSphere Console (RVC) is an interactive command-line console user interface for VMware vSphere and Virtual Center.

The Ruby vSphere Console comes bundled with both the vCenter Server Appliance (VCSA) and the Windows version of vCenter Server. RVC is quickly becoming one of the primary tools for managing and troubleshooting Virtual SAN environments

How to begin

  • To begin using the Ruby vSphere Console to manage your vSphere infrastructure, deploy the vCenter Server Appliance and configure network connectivity for the appliance.
  • Afterwards, SSH using Putty or an app you prefer to the dedicated vCenter Server Appliance and login as a privileged user. No additional configuration is required to begin.
  • Commands such as ‘cd’ and ‘ls’ work fine and if you want to return to the previous directory type ‘cd .. and press Enter

How to Login

RVC credentials are directly related to the default domain setting in SSO (Single Sign-On). Verify the default SSO Identity Source is set to the desired entity.

So there are a few different ways to logon potentially either locally or with domain credentials. Examples below

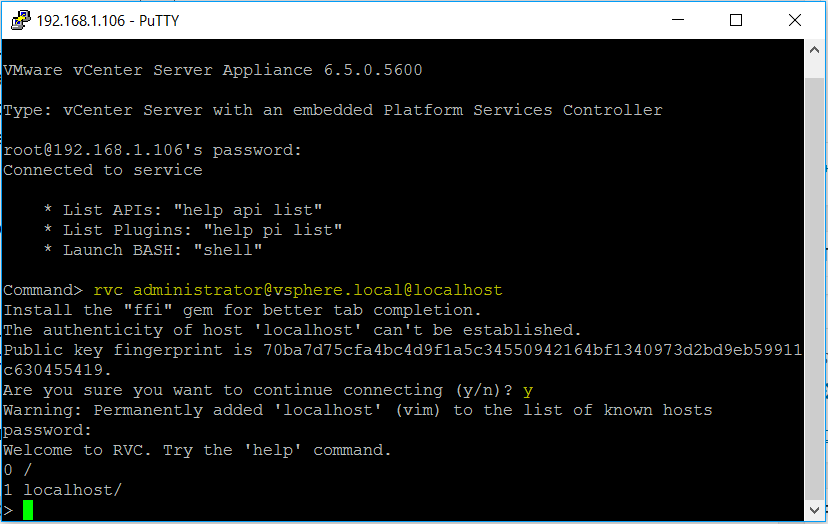
  • rvc administrator@vsphere.local@localhost
  • rvc root@localhost
  • rvc administrator@techlab.local@localhost

Where to go from here

You are now at the root of the virtual filesystem.

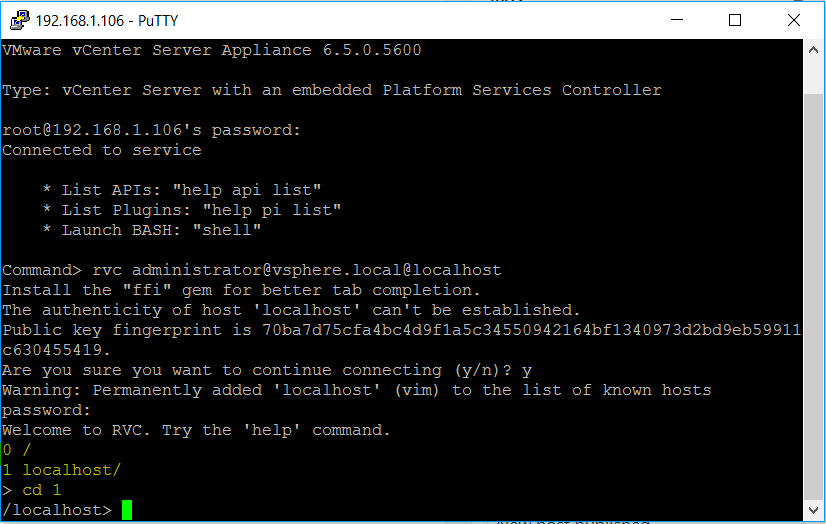
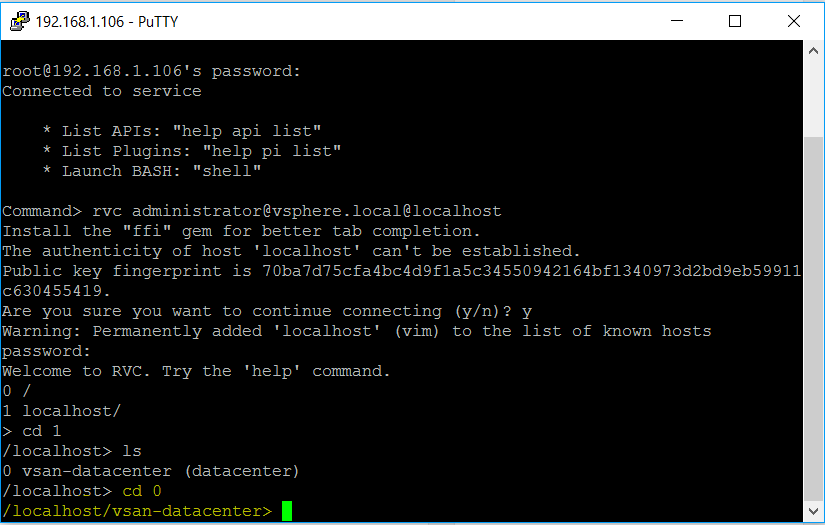
  • To access and navigate through the system type ‘cd 0‘ to access the root (/) directory or ‘cd 1‘ to access the ‘localhost/’ directory. You can type the ‘ls’ command to list the contents of a directory. I am going to type ‘cd 1‘ to access my localhost directory so lets see what we have.

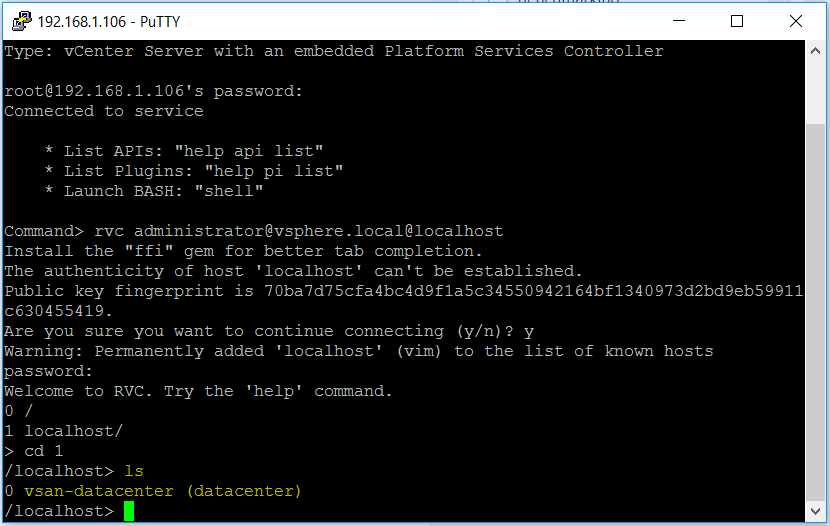
  • Type ls to see what directory structure we have now. You should now see your datacenter or datacenters

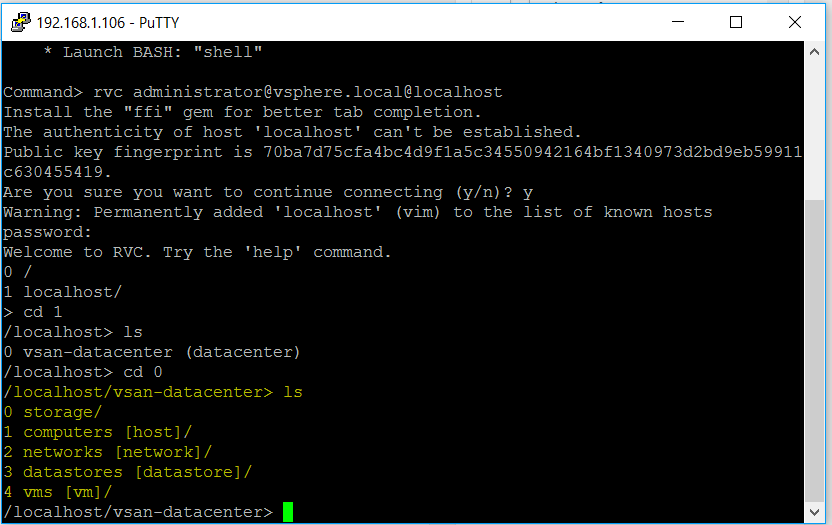
  • Change directory by typing cd 0 to the relevant datacenter and you will now see the following folder structure.

  • Type ls to see the structure of this folder

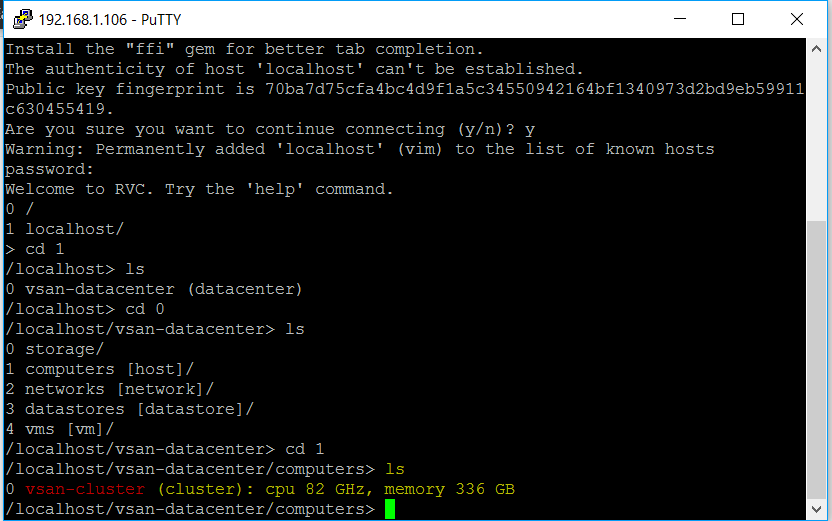
  • Type cd 1 to change to the Computers folder where we will see the cluster and then type ls

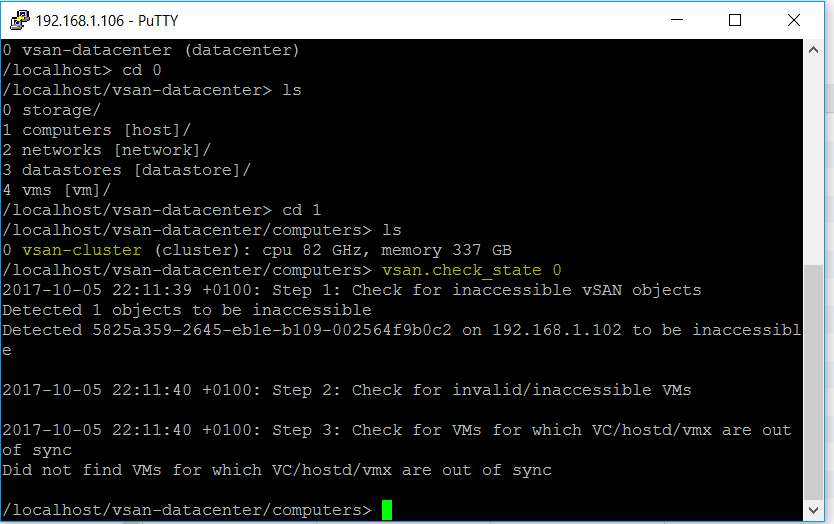
  • We can now use a command to check the state of the vSAN cluster. You don’t want to enter the command ‘vsan.check_state vsan-cluster’ as that will not work. The number ‘0’ is what you need to use to look at the state of the cluster so type vsan.check_state 0

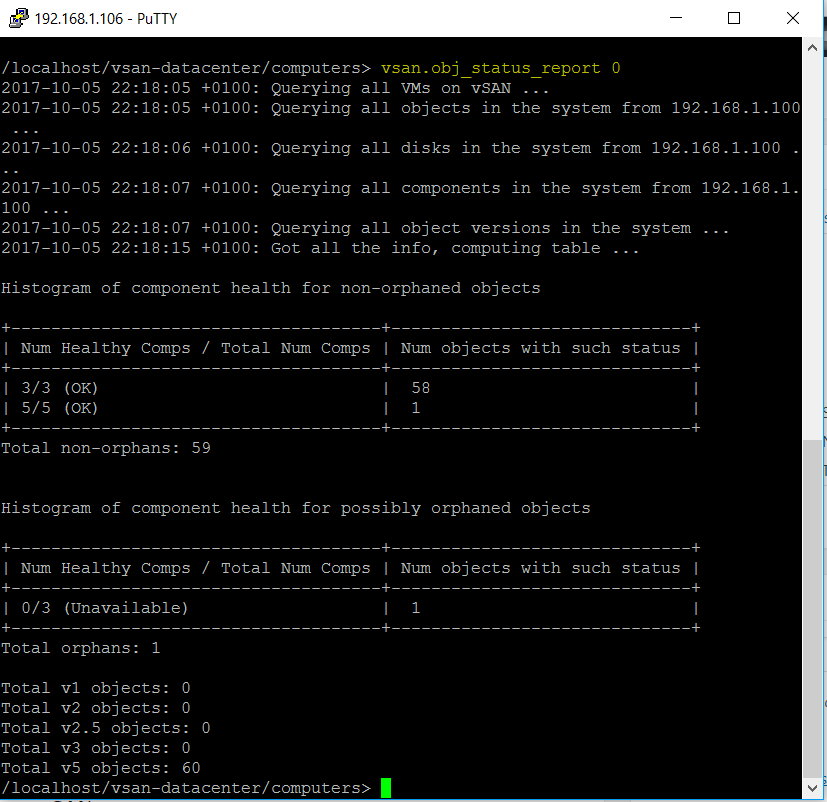
  • Next look at the vSAN Object Status Report. Type vsan.obj_status_report 0

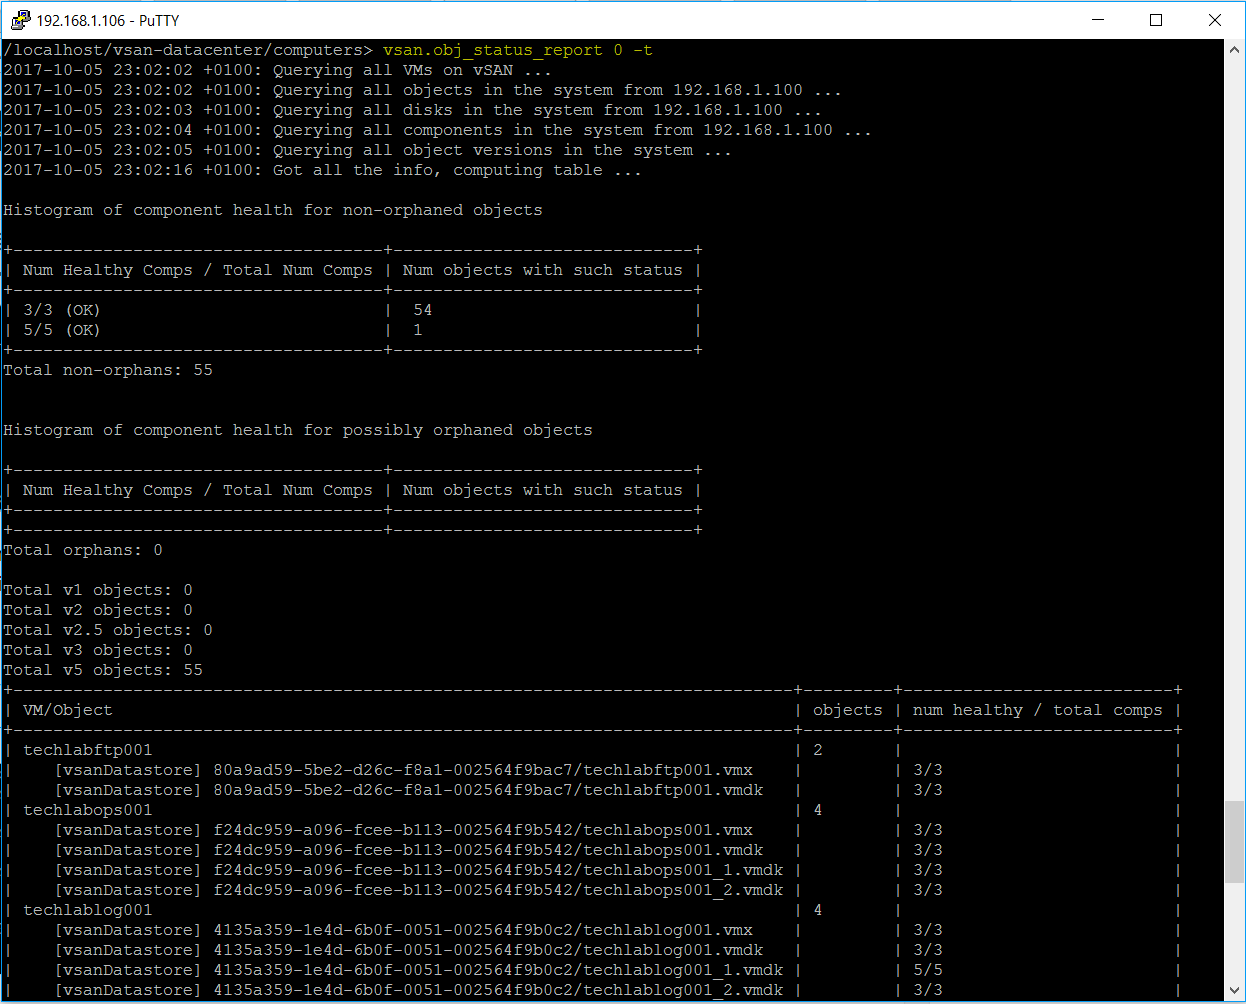
  • We can also run the command vsan.obj_status_report 0 -t which displays a table with more information about vSAN objects

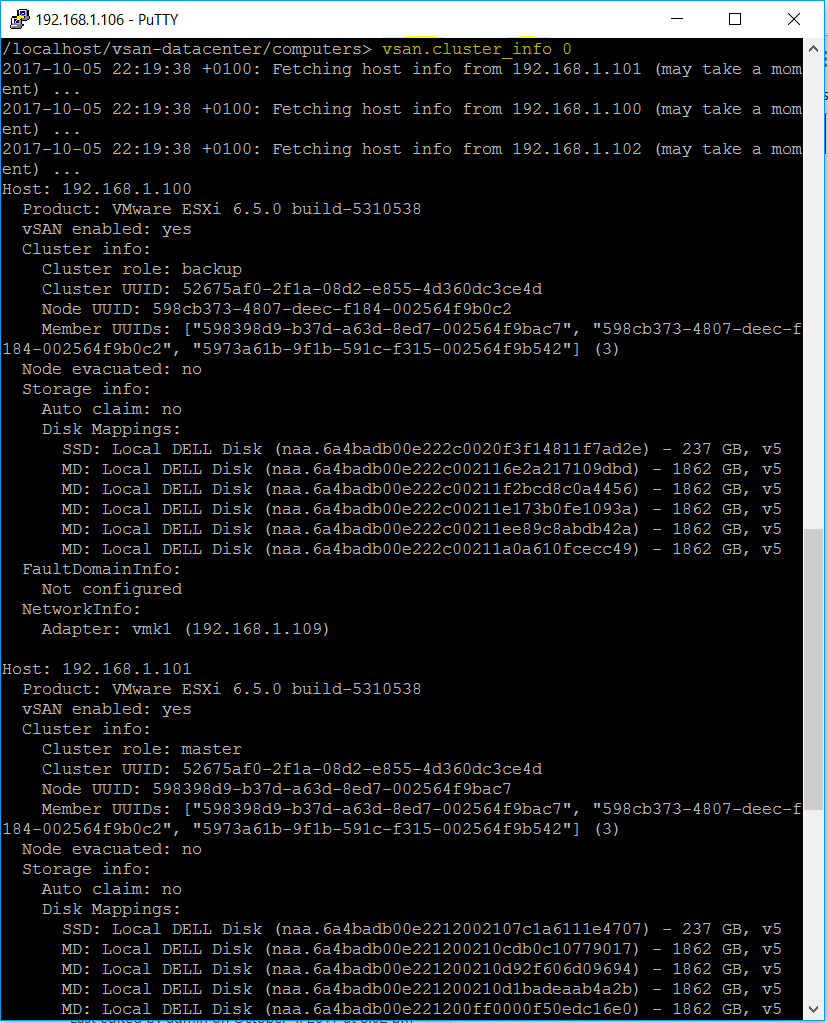
  • Next look at a detailed view of the cluster. Type vsan.cluster_info 0

  • Next we’ll have a look at disk stats. Type vsan.disks_stats 0

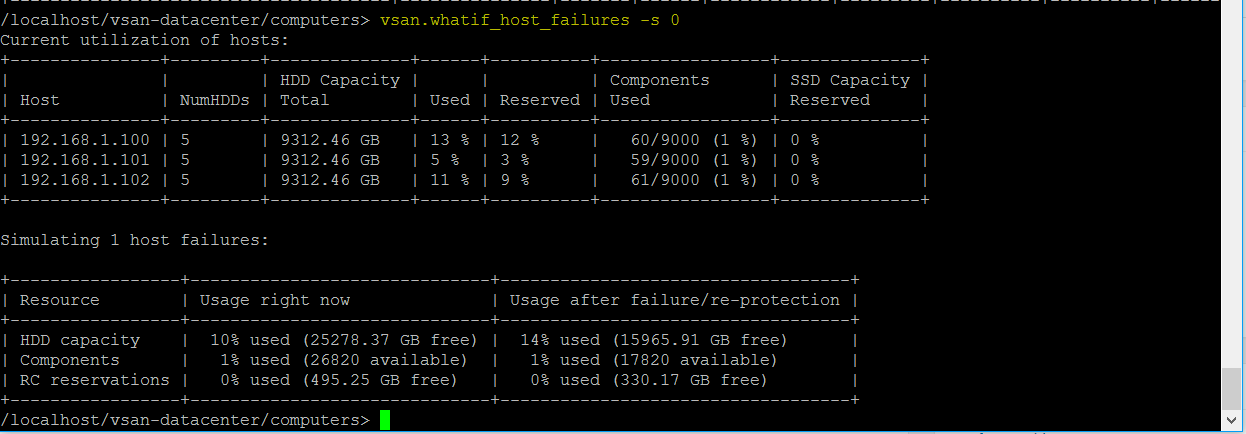
  • Next have a look at simulating a failure of a host on your vSAN cluster. type vsan.whatif_host_failures 0

  • You can also type vsan.whatif_host_failures -s 0

  • You can also view VM performance by typing vsan.vm_perf_stats “vm” This command will sample disk performance over a period of 20 seconds. This command will provide you with ‘read/write’ information IOPS, throughput and latency

Using vSAN Observer

Click me –> https://kb.vmware.com/selfservice/microsites/search.do?language=en_US&cmd=displayKC&externalId=2064240

To generate a performance statistics bundle over a one hour period at 30 second intervals for a vSAN cluster named vSAN and save the generated statistics bundle to the /tmp folder, run this command:

  • Log into rvc
  • Navigate down to Computers
  • Type the following vsan.observer ~/computers/clustername(fill this in)/ –run-webserver –force –generate-html-bundle /tmp –interval 30 –max-runtime 1
  • While this is running, you can log into a web browser and run http://vCentername:8010 which will provide multiple graphs and information you can view
  • Press Control C to stop if you want to stop this prior to the test ending.

Inaccessible objects or orphaned objects

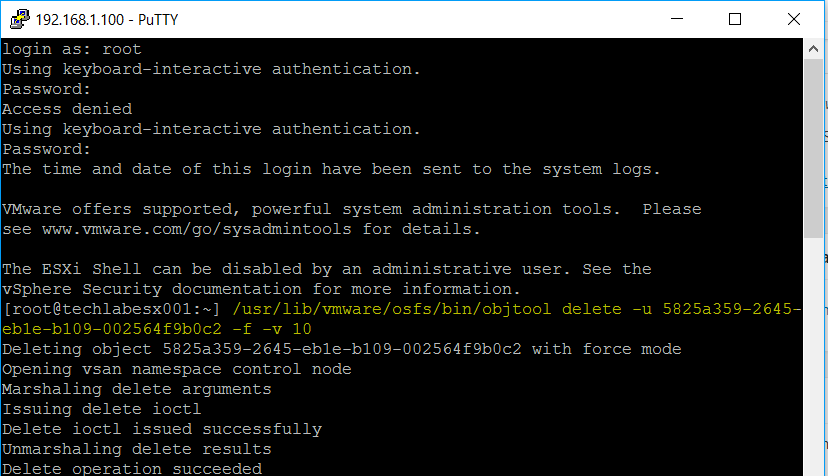
If you get an issue like I did with an orphaned object then browse through the vSAN datastore in the Web Client and find the GUID of the object and run the following command on the hosts. Take care you have the correct GUID! The first command checks the GUID and the second command deletes the GUID.

  • /usr/lib/vmware/osfs/bin/objtool getAttr -u 5825a359-2645-eb1e-b109-002564f9b0c2
  • /usr/lib/vmware/osfs/bin/objtool delete -u 5825a359-2645-eb1e-b109-002564f9b0c2 -f -v 10
  • Give it a minute and you will see it vanish from your vSAN datastore

Useful Commands

Within the RVC Console, type in vsan. then press tab twice to get the whole list of vsan commands you can use.

On the hosts the following commands can be useful

  • cd /etc/init.d/vsanmgmtd status
  • cd /etc/init.d/vsanmgmtd restart

Using HCIBench v1.6.3 to performance test vSAN 6.6

vSAN Load Testing Tool: HCIBench

*Note* HCIBench is now on v1.6.6 – Use this version.

VMware has a vSAN Stress and Load testing tool called HCIBench, which is provided via VMware’s fling capability. HCIbench can be run in versions 5.5 and upwards today as a replacement for the vSAN Proactive tests which are inbuilt into vSAN currently. I am running this against vSphere 6.5/vSAN 6.6 today. HCIBench provides more flexibility in defining a target performance profile as input and test results from HCIBench can be viewed in a web browser and saved to disk.

HCIBench will help simplify the stress testing task, as HCIBench asks you to specify your desired testing parameters (size of working set, IO profile, number of VMs and VMDKs, etc.) and then spawns multiple instances of Vdbench on multiple servers. If you don’t want to configure anything manually there is a button called Easyrun which will set everything for you. After the test run is done, it conveniently gathers all the results in one place for easy review and resets itself for the next test run.

HCIBench is not only a benchmark tool designed for vSAN, but also could be used to evaluate the performance of all kinds of Hyper-Converged Infrastructure Storage in vSphere environment.

Where can I can find HCI Bench?

There is a dedicated fling page which will provide access to HCIBench and its associated documentation. A zip file containing the Vdbench binaries from Oracle will also be required to be downloaded which can be done through the configuration page after the appliance is installed. You will need to register an account with Oracle to download this file but this doesn’t take long.

HCIBench Download: labs.vmware.com/flings/hcibench

HCIBench User Guidehttps://download3.vmware.com/software/vmw-tools/hcibench/HCIBench_User_Guide.pdf

Requirements

  • Web Browser: IE8+, Firefox or Chrome
  • vSphere 5.5 and later environments for both HCIBench and its client VMs deployment

HCIBench Tool Architecture

The tool is specifically designed for running performance tests using Vdbench against a vSAN datastore.
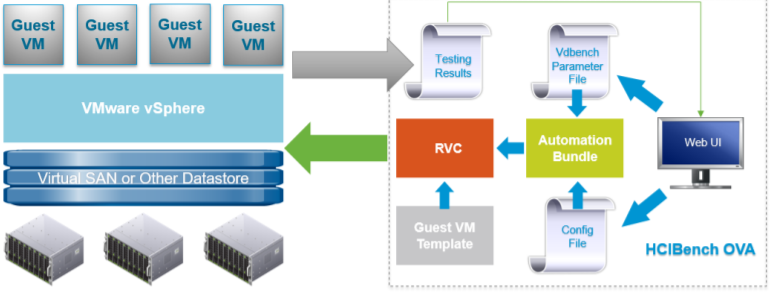
It is delivered in the form of Open Virtualization Appliance (OVA) that includes the following components:

The test Controller VM is installed with:

  • Ruby vSphere Console (RVC)
  • vSAN Observer
  • Automation bundle
  • Configuration files
  • Linux test VM template

The Controller VM has all the needed components installed. The core component is RVC (https://github.com/vmware/rvc) with some extended features enabled. RVC is the engine of this performance test tool, responsible for deploying Vdbench Guest VMs, conducting Vdbench runs, collecting results, and monitoring vSAN by using vSAN Observer.

VM Specification Controller VM

  • CPU: 8 vCPU
  • RAM: 4GB
  • OS VMDK: 16GB
  • Operating system: Photon OS 1.0
  • OS Credential: user is responsible for creating the root password when deploying the VM.
  • Software installed: Ruby 2.3.0, Rubygem 2.5.1, Rbvmomi 1.8.2, RVC 1.8.0, sshpass 1.05, Apache 2.4.18, Tomcat 8.54, JDK 1.8u102

Vdbench Guest VM

  • CPU: 4 vCPU
  • RAM: 4GB
  • OS VMDK: 16GB
  • OS: Photon OS 1.0
  • OS Credential: root/vdbench
  • Software installed: JDK 1.8u102, fio 2.13  SCSI Controller Type: VMware Paravirtual
  • Data VMDK: number and size to be defined by user

Pre-requisites

Before deploying this performance test tool packaged as OVA, make sure the environment meets the following requirements:

The vSAN Cluster is created and configured properly

  • The network for Vdbench Guest VMs is ready, and needs to have DHCP service enabled; if the network doesn’t have DHCP service, “Private Network” must be mapped to the same network when HCIBench being deployed.
  • The vSphere environment where the tool is deployed can access the vSAN Cluster environment to be tested
  • The tool can be deployed into any vSphere environment. However, we do not recommend deploying it into the vSAN Cluster that is tested to avoid unnecessary resource consumption by the tool.

What am I benchmarking?

This is my home lab which runs vSAN 6.6 on 3 x Dell Poweredge T710 servers each with

  • 2 x 6 core X5650 2.66Ghz processors
  • 128GB RAM
  • 6 x Dell Enterprise 2TB SATA 7.2k hot plug drives
  • 1 x Samsung 256GB SSD Enterprise 6.0Gbps
  • Perc 6i RAID BBWC battery-backed cache
  • iDRAC 6 Enterprise Remote Card
  • NetXtreme II 5709c Gigabit Ethernet NIC

Installation Instructions

  • Download the HCIBench OVA from https://labs.vmware.com/flings/hcibench and deploy it to your vSphere 5.5 or later environment.
  • Because the vApp option is used for deployment, HCIBench doesn’t support deployment on a standalone ESXi host, the ESXi host needs to be managed by a vCenter server.
  • When configuring the network, if you don’t have DHCP service on the VLAN that the VDBench client VMs will be deployed on, the “Private Network” needs to be mapped to the same VLAN because HCIBench will be able to provide the DHCP service.
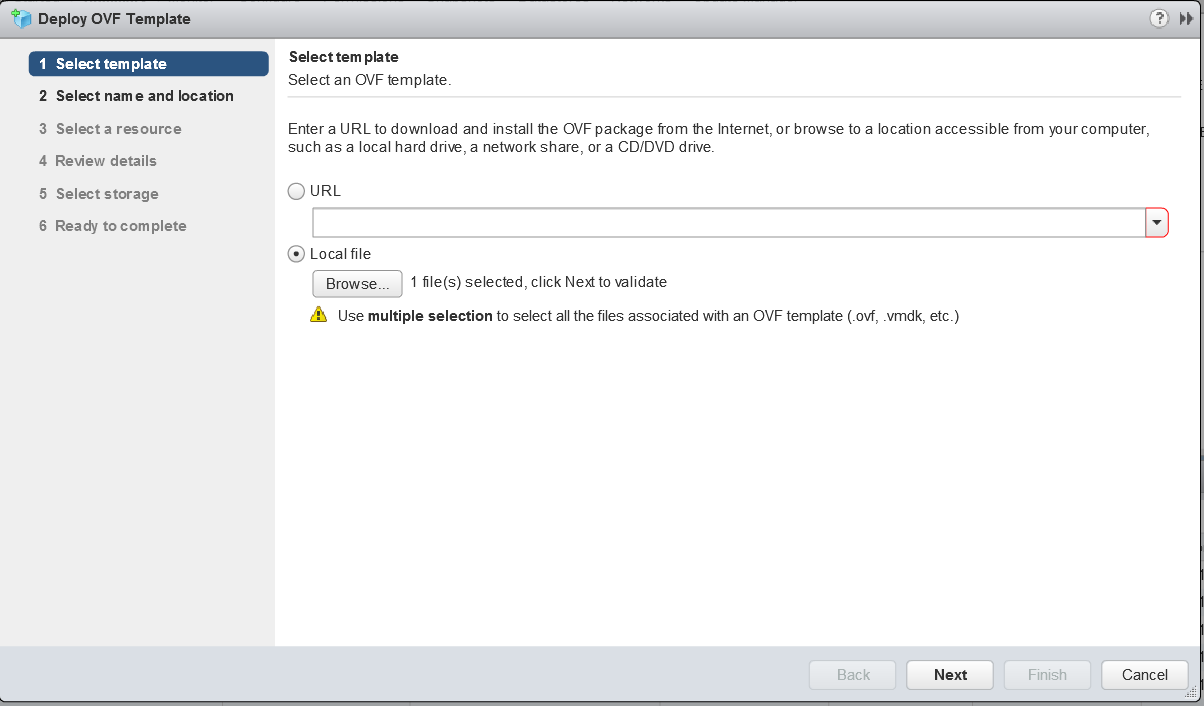
  • Log into vCenter and go to File > Deploy OVF File

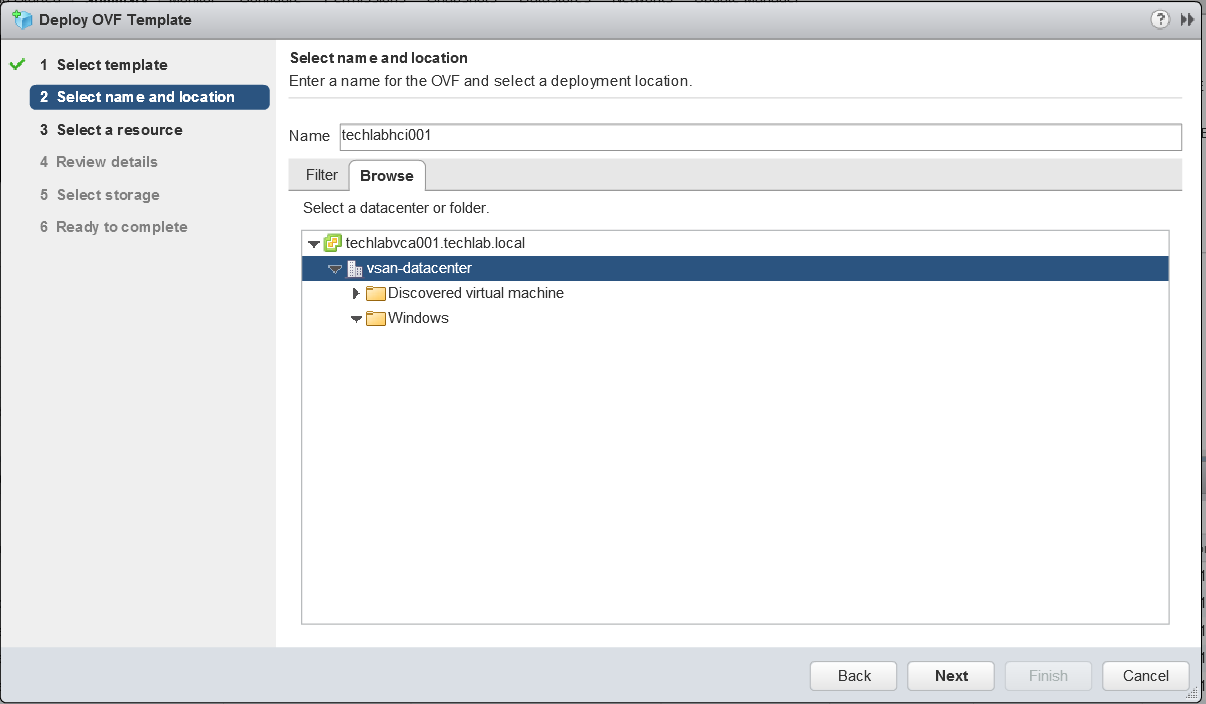
  • Name the machine and select a deployment location

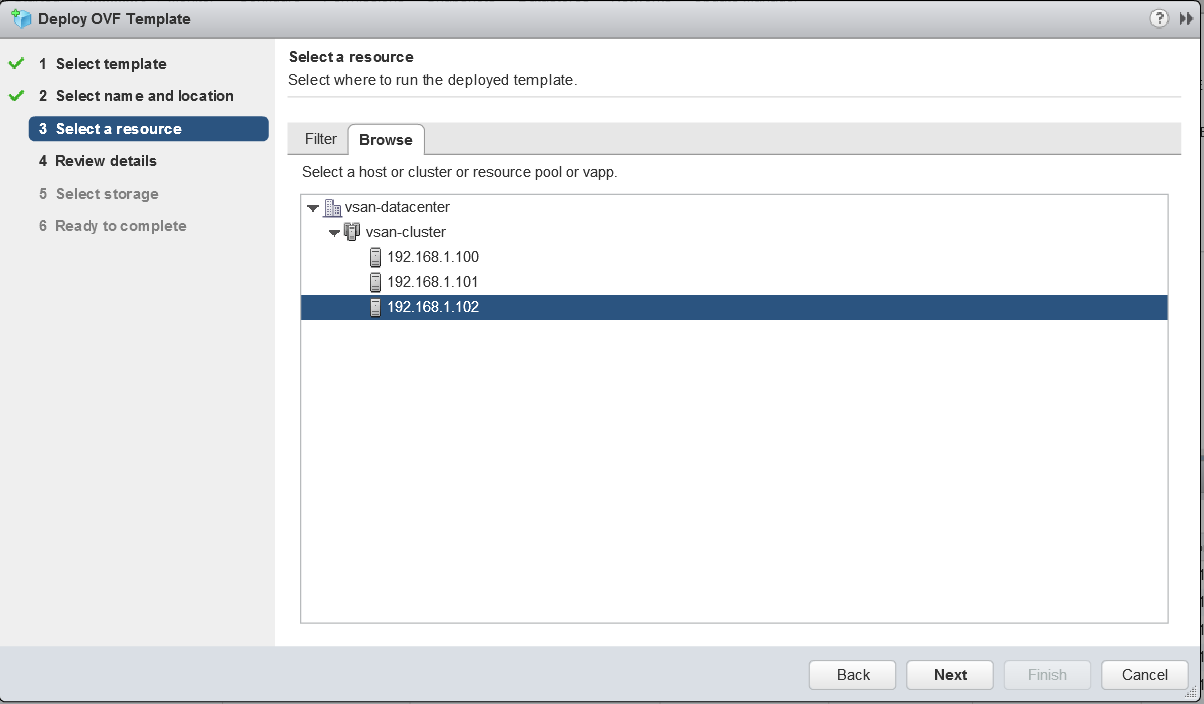
  • Select where to run the deployed template. I’m going to run it on one of my host local datastores as it is recommended to run it in a location other than the vSAN.

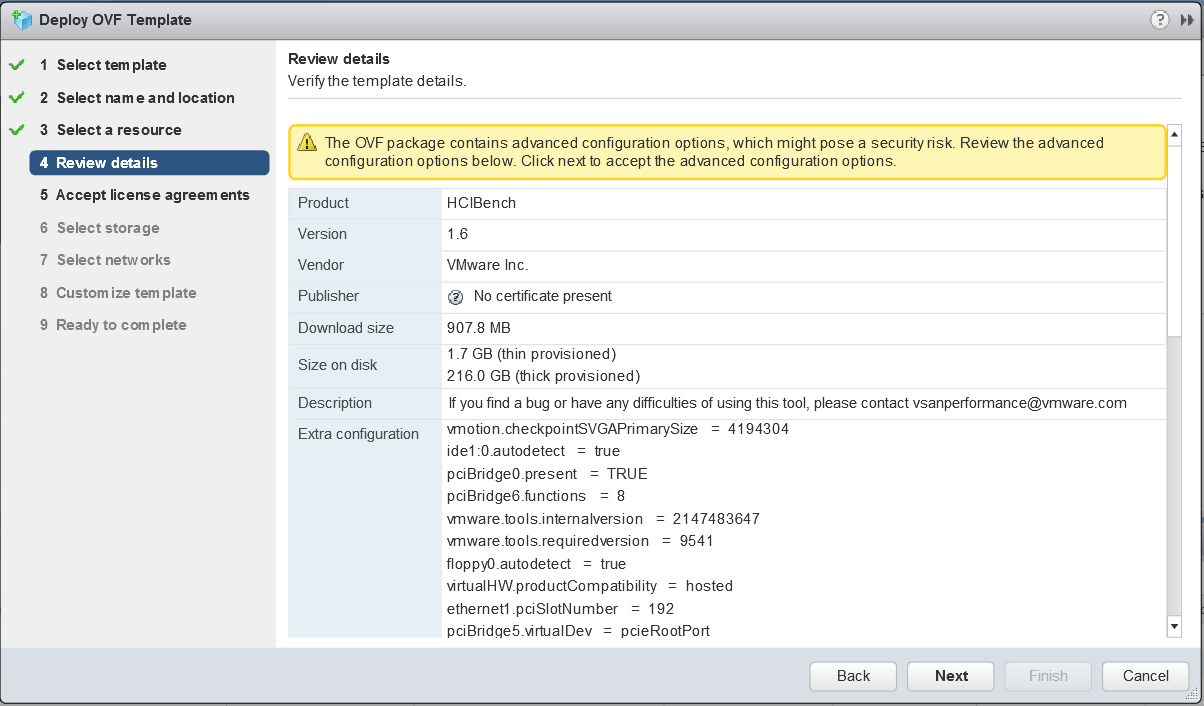
  • Review the details

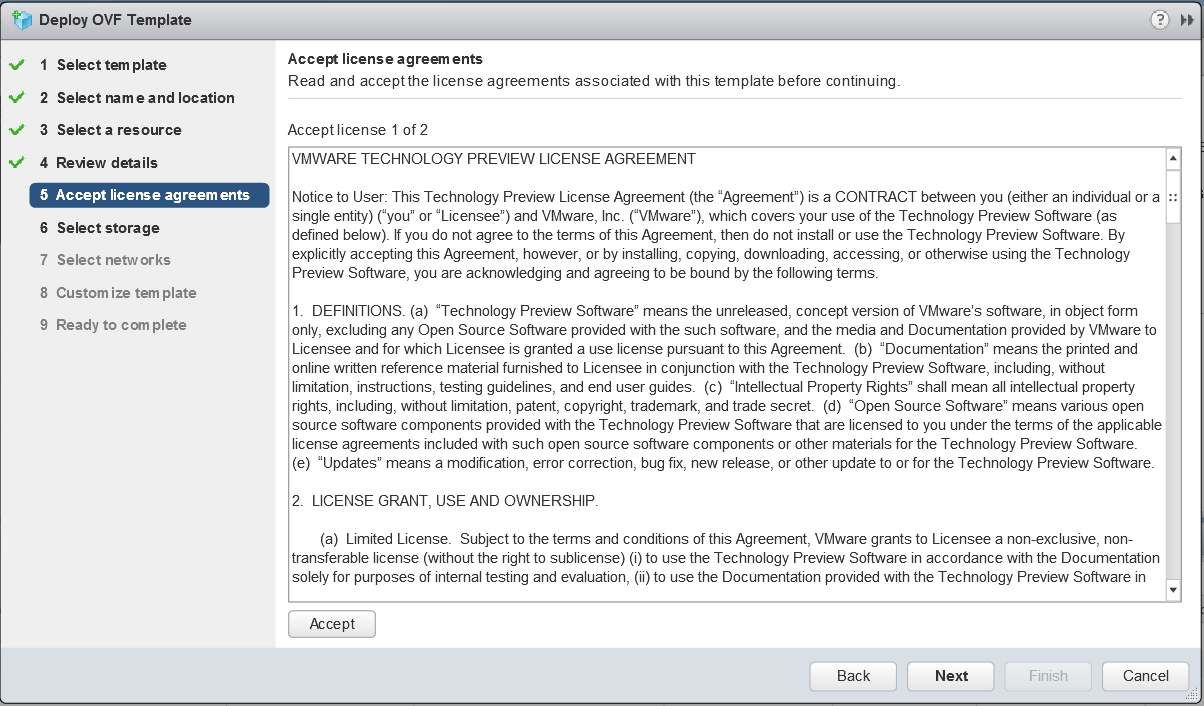
  • Accept the License Agreement

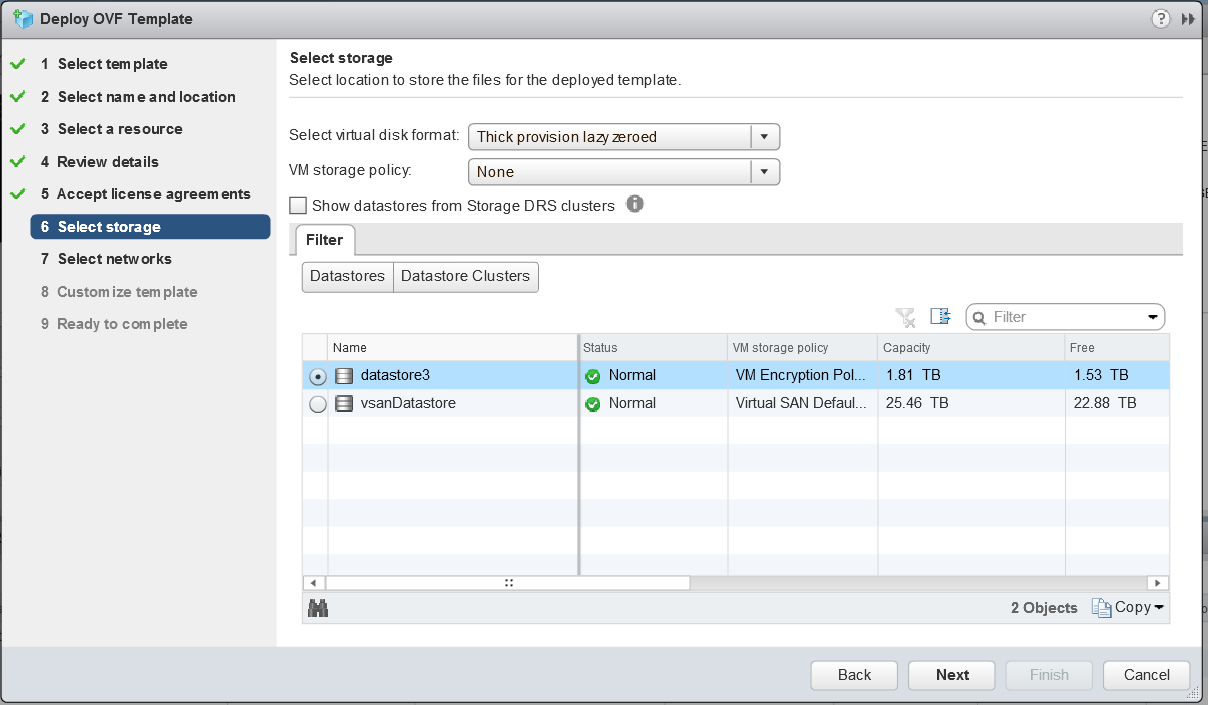
  • Select a storage location to store the files for the deployed template

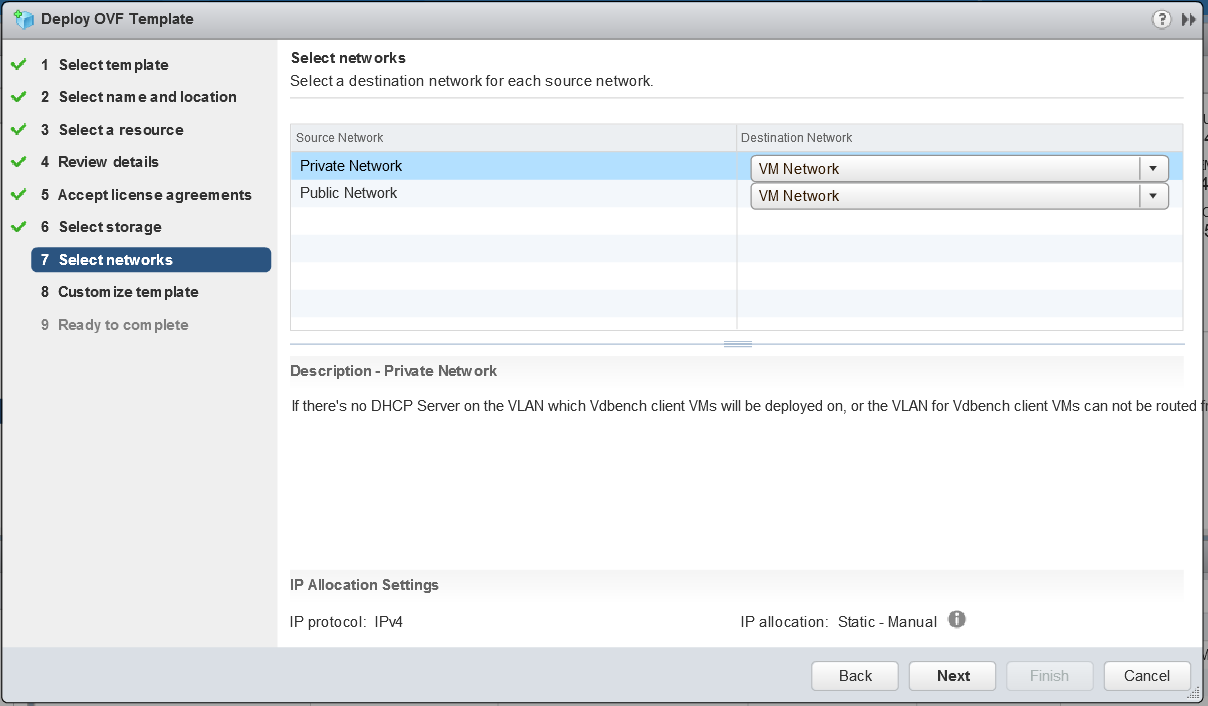
  • Select a destination network for each source network
  • Map the “Public Network” to the network which the HCIBench will be
    accessed through; if the network prepared for Vdbench Guest VM doesn’t have DHCP service, map the “Private Network” to the same network, otherwise just ignore the “Private Network”.

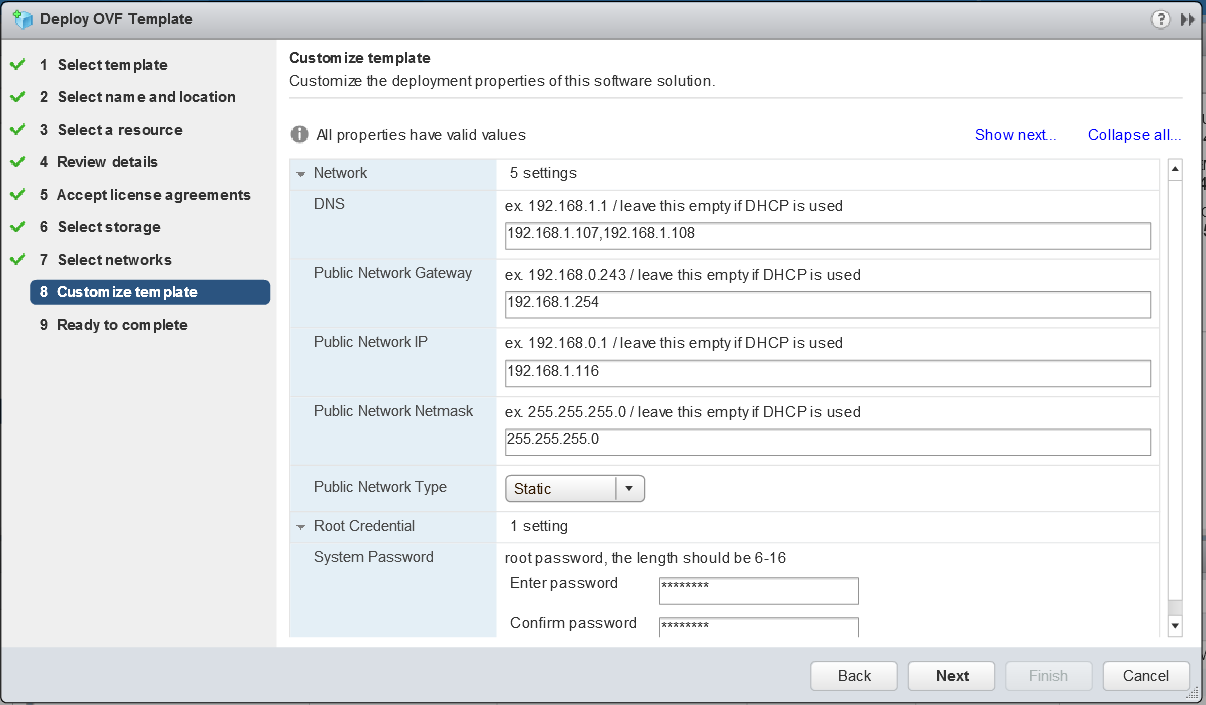
  • Enter the network details. I have chosen static and filled in the detail as per below. I have a Windows DHCP Server on my network which will issue IP Addresses to the worker VMs.
  • Note: I added the IP Address of the HCIBench appliance into my DNS Server

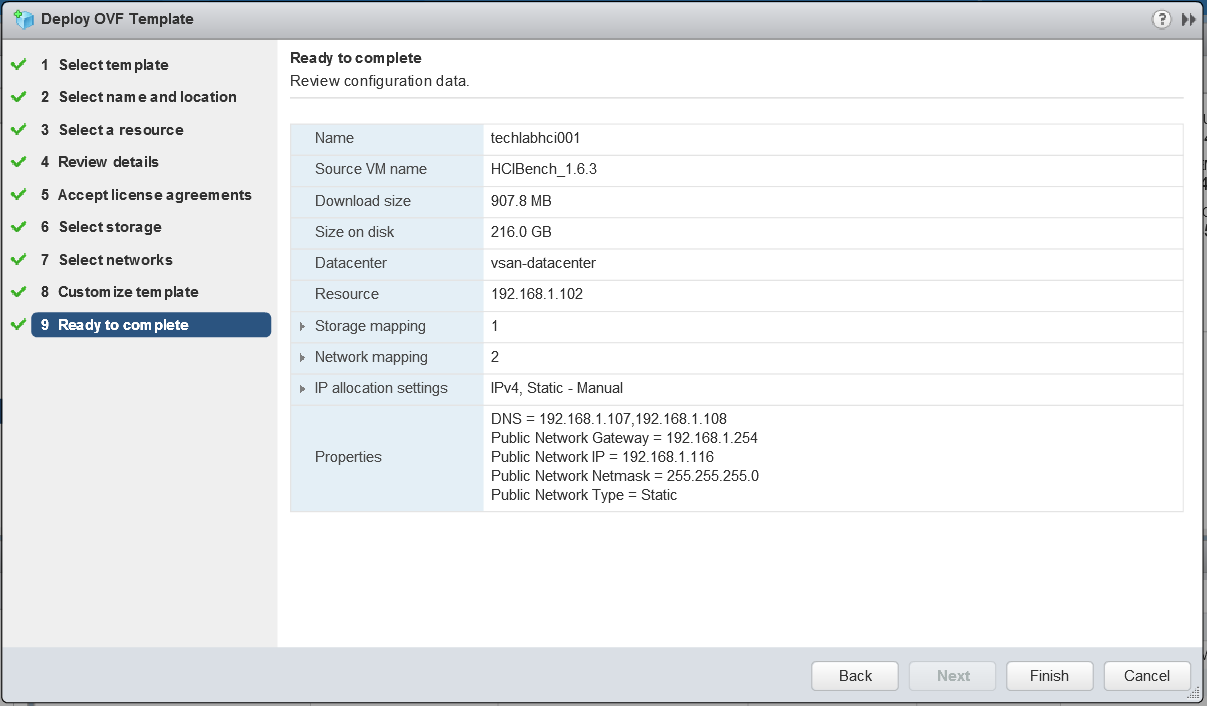
  • Click Next and check all the details

  • The OVF should deploy. If you get a failure with the message. “The OVF failed to deploy. The ovf descriptor is not available” then redownload the OVA and try again and it should work.

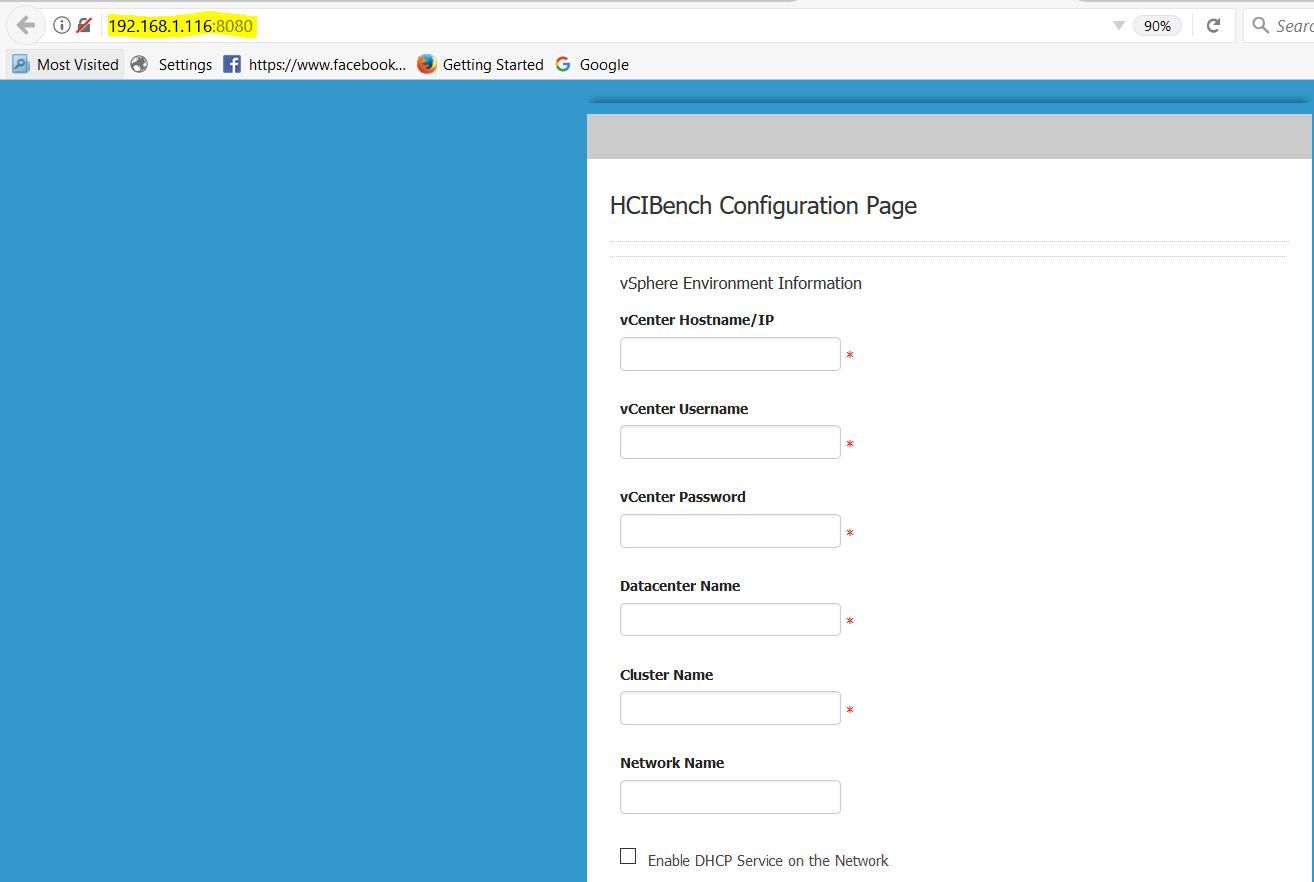
  • Next power on the Controller VM and go to your web browser and navigate to your VM using http://<Your_HCIBench_IP>:8080. In my case http://192.168.1.116:8080. Your IP is the IP address you gave it during the OVF deployment or the DHCP address it picked up if you chose this option. If it asks you for a root password, it is normally what you set in the Deploy OVF wizard.
  • Log in with the root account details you set and you’ll get the Configuration UI

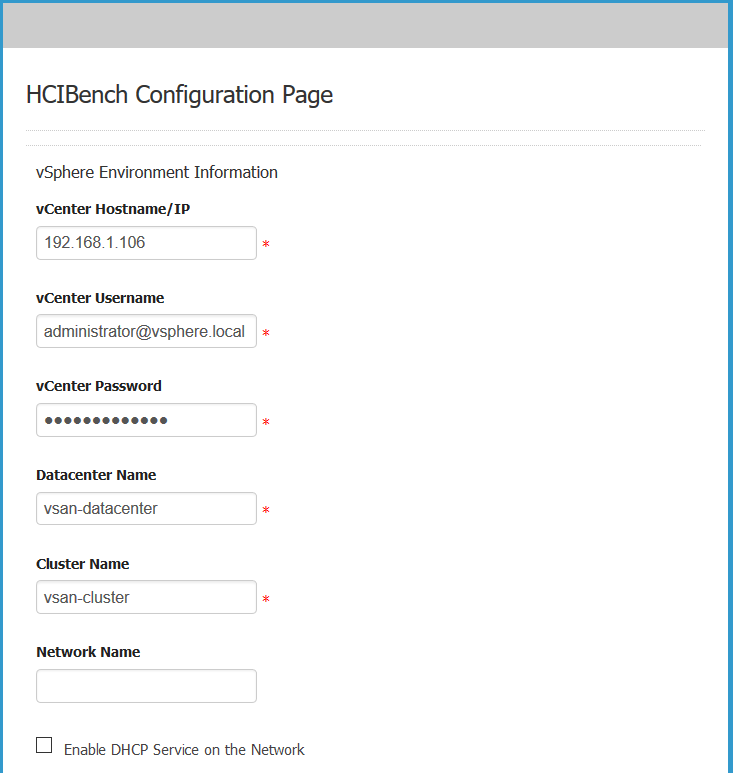
  • Go down the whole list and fill in each field. The screen-print shows half the configuration
  • Fill in the vCenter IP or FQDN
  • Fill in the vCenter Username as username@domain format
  • Fill in the Center Password
  • Fill in your Datacenter Name
  • Fill in your Cluster Name
  • Fill in the network name. If you don’t fill anything in here, it will assume the “VM Network” Note: This is my default network so I left it blank.
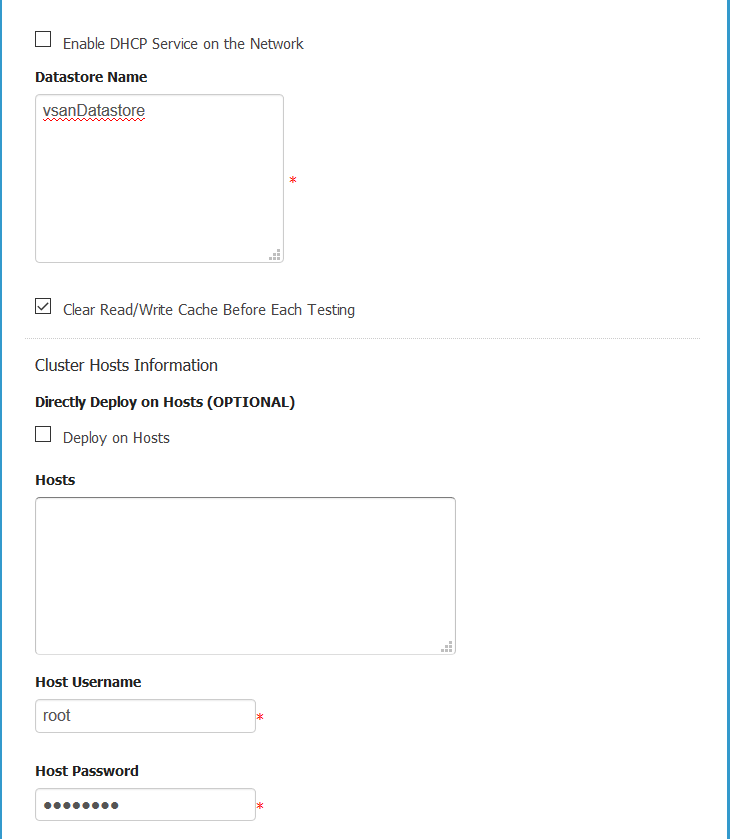
  • You’ll see a checkbox for enabling DHCP Service on the network. DHCP is required for all the Vdbench worker VMs that HCIBench will produce so if you don’t have DHCP on this network, you will need to check this box so it will assign addresses for you. As before I have a Windows DHCP server on my network so I won’t check this.

  • Next enter the Datastore name of the datastore you want HCIBench to test so for example I am going to put in vsanDatastore which is the name of my vSAN.
  • Select Clear Read/Write Cache Before Each Testing which will make sure that test results are not skewed by any data lurking in the cache. It is designed to flush the cache tier prior to testing.
  • Next you have the option to deploy the worker VMs directly to the hosts or whether HCIBench should leverage vCenter

If this parameter is unchecked, ignore the Hosts field below, for the Host Username/Password fields can also be ignored if Clear Read/Write Cache Before Each Testing is unchecked. In this mode, a Vdbench Guest VM is deployed by the vCenter and then is cloned to all hosts in the vSAN Cluster in a round-robin fashion. The naming convention of Vdbench Guest VMs deployed in this mode is
“vdbench-vc-<DATASTORE_NAME>-<#>”.
If this parameter is checked, all the other parameters except EASY RUN must be specified properly.
The Hosts parameter specifies IP addresses or FQDNs of hosts in the vSAN Cluster to have Vdbench Guest VMs deployed, and all these hosts should have the same username and password specifed in Host Username and Host Password. In this mode, Vdbench Guest VMs are deployed directly on the specified hosts concurrently. To reduce the network traffic, five hosts are running deployment at the same time then it moves to the next five hosts. Each host also deploys at an increment of five VMs at a time.

The naming convention of test VMs deployed in this mode is “vdbench-<HOSTNAME/IP>-<DATASTORE_NAME>-batch<VM#>-<VM#>”.

In general, it is recommended to check Deploy on Hosts for deployment of a large number of testVMs. However, if distributed switch portgroup is used as the client VM network, Deploy on Hosts must be unchecked.
EASY RUN is specifically designed for vSAN user, by checking this, HCIBench is able to handle all the configurations below by identifying the vSAN configuration. EASY RUN helps to decide how many client VMs should be deployed, the number and size of VMDKs of each VM, the way of preparing virtual disks before testing etc. The configurations below will be hidden if this option is checked.

  • You can omit all the host details and just click EASYRUN

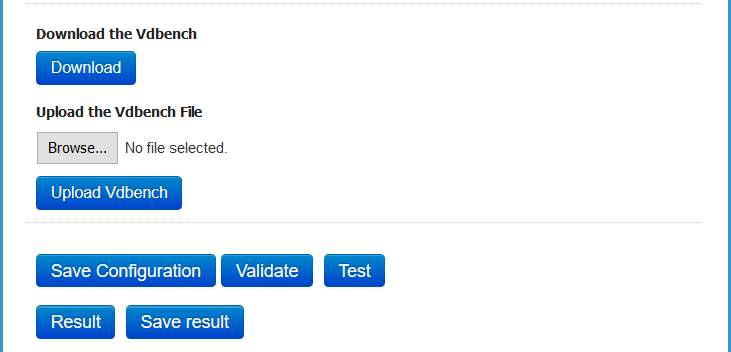
  • Next Download the vDBench zip file and upload it as it is. Note: you will need to create yourself an Oracle account if you do not have one.

  • It should look like this. Click Upload

  • Click Save Configuration

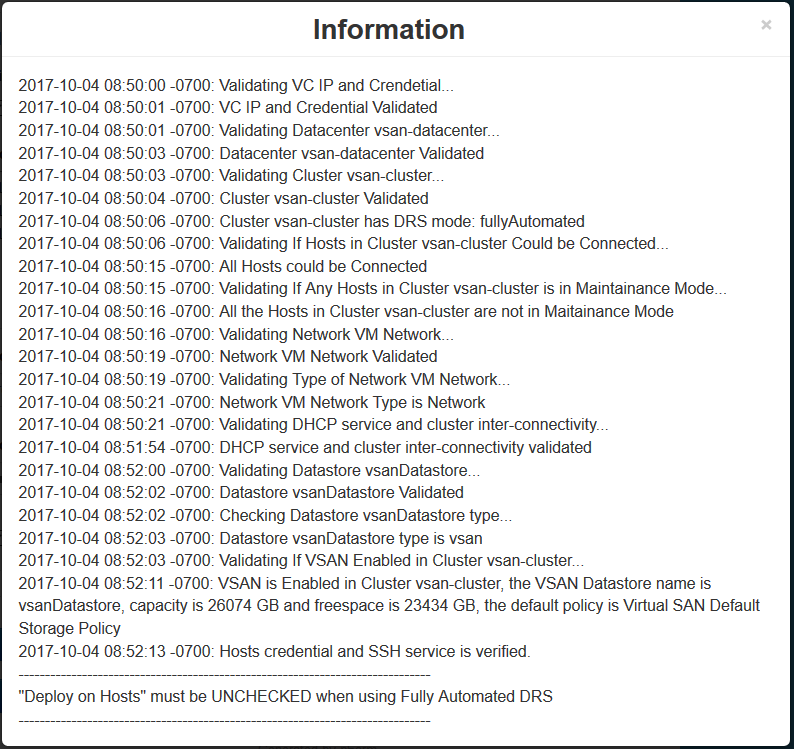
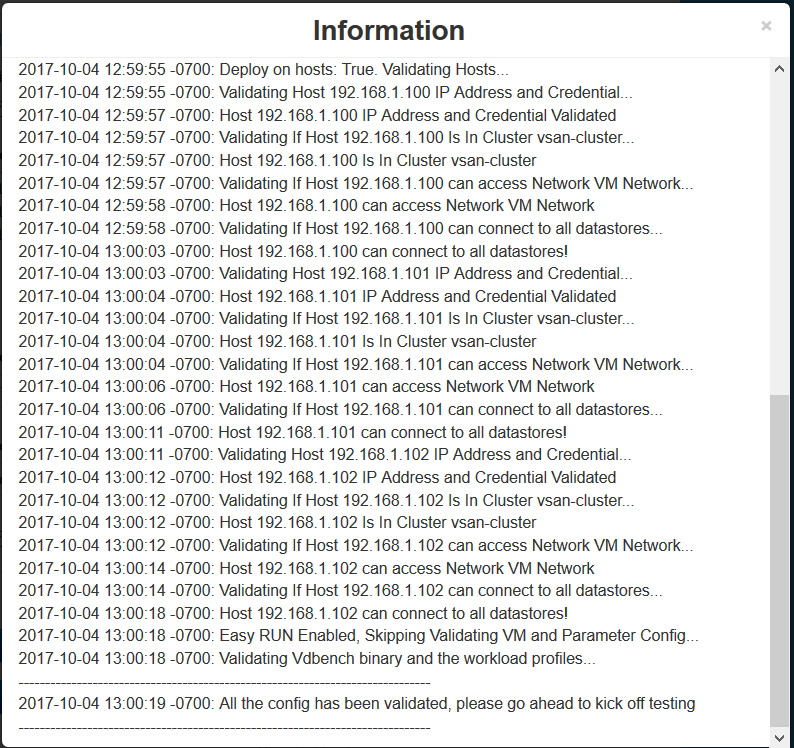
  • Click Validate the Configuration.Note at the bottom, it is saying to “Deploy on hosts must be unchecked” when using fully automated DRS. As a result I changed my cluster DRS settings to partially automated and then I got the correct message below when I validated again.

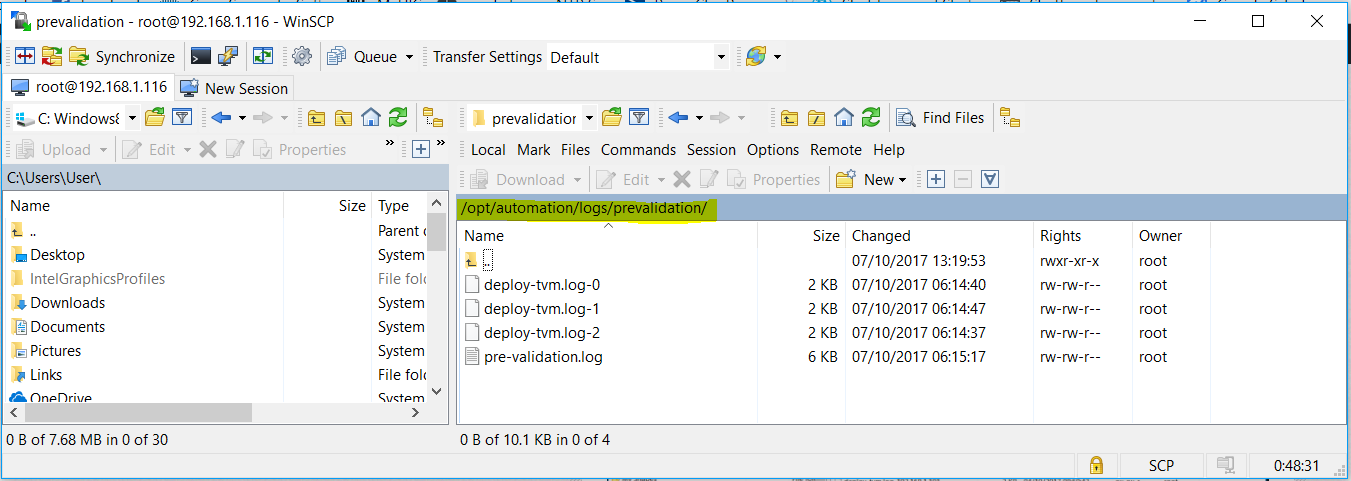
  • If you get any issues, please look at the Pre-validation logs located here – /opt/automation/logs/prevalidation

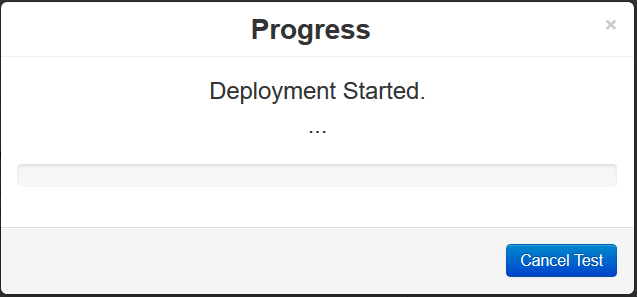
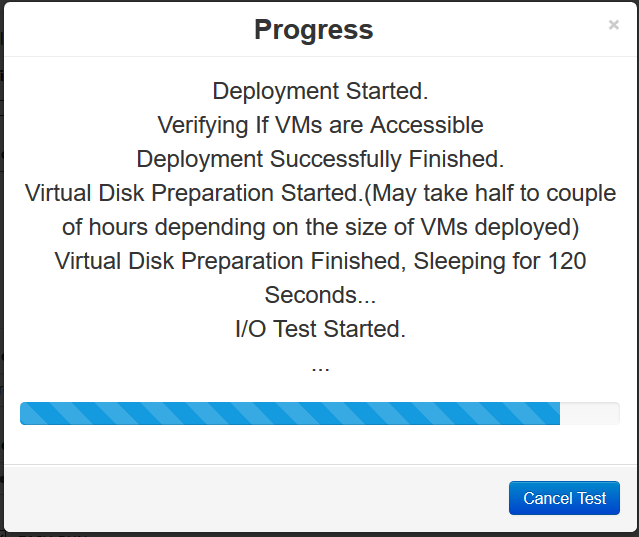
  • Next we can start a Test. Click Test

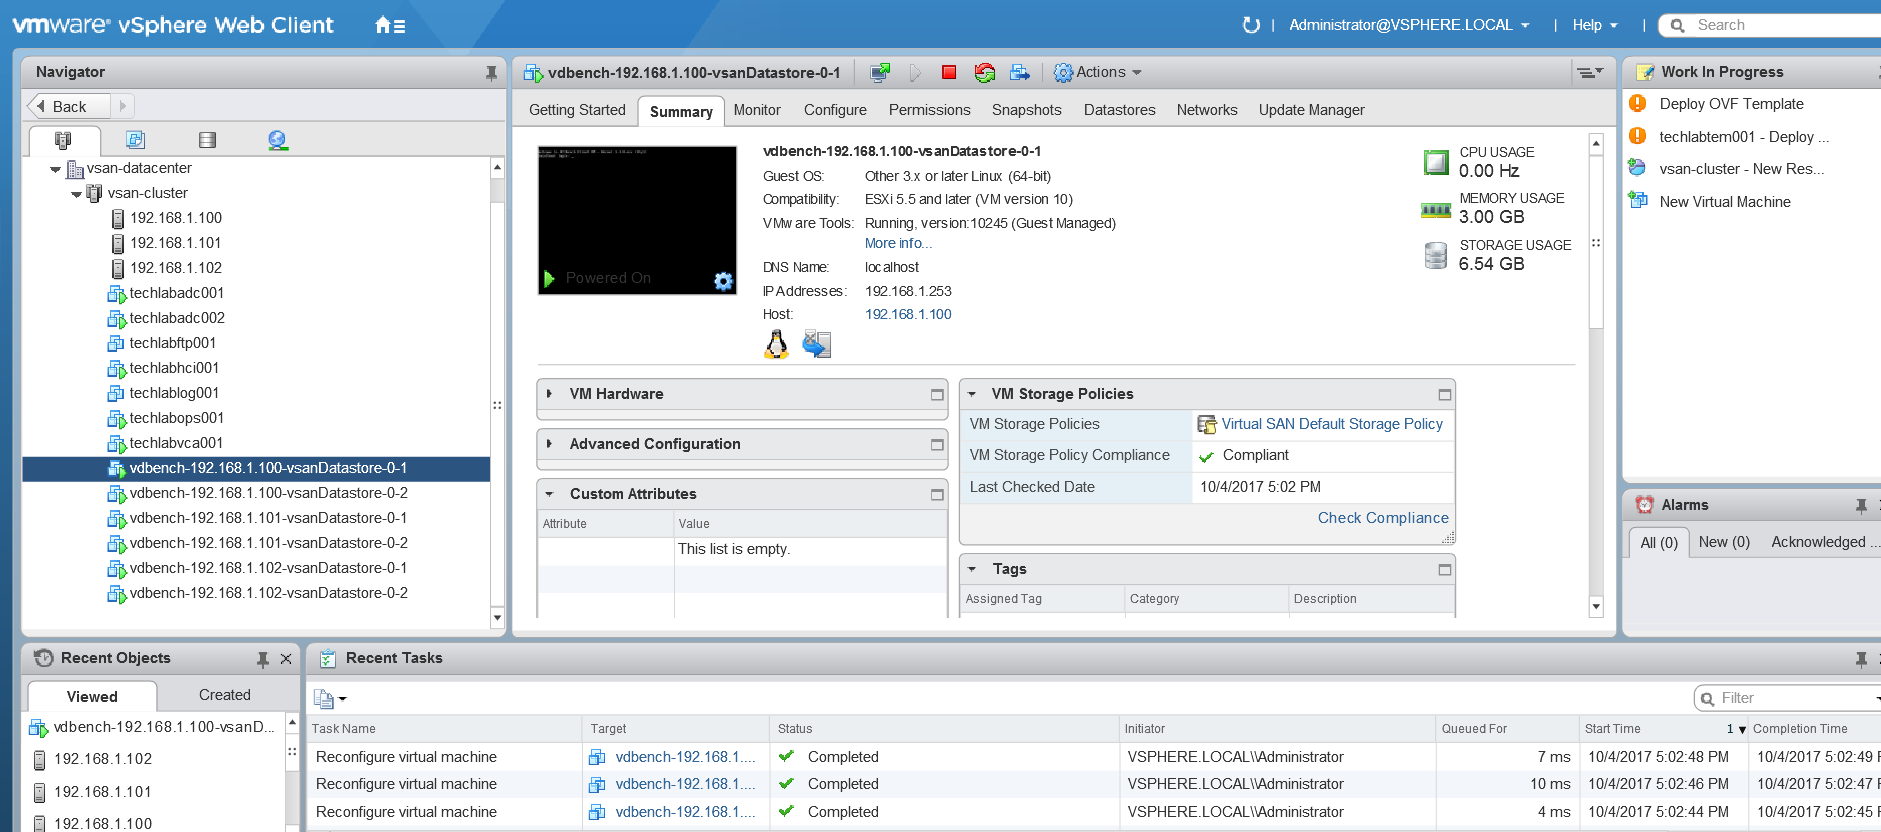
  • You will see the VMs being deployed in vCenter

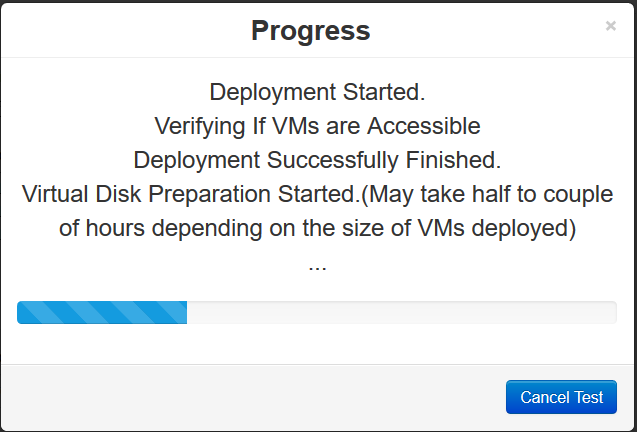
  • And more messages being shown

  • It should finish and say Test is finished

Results

  • Just as a note after the first test, it is worth checking that the Vms are spread evenly across all the hosts you are testing!
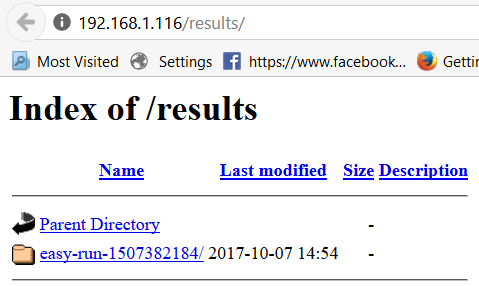
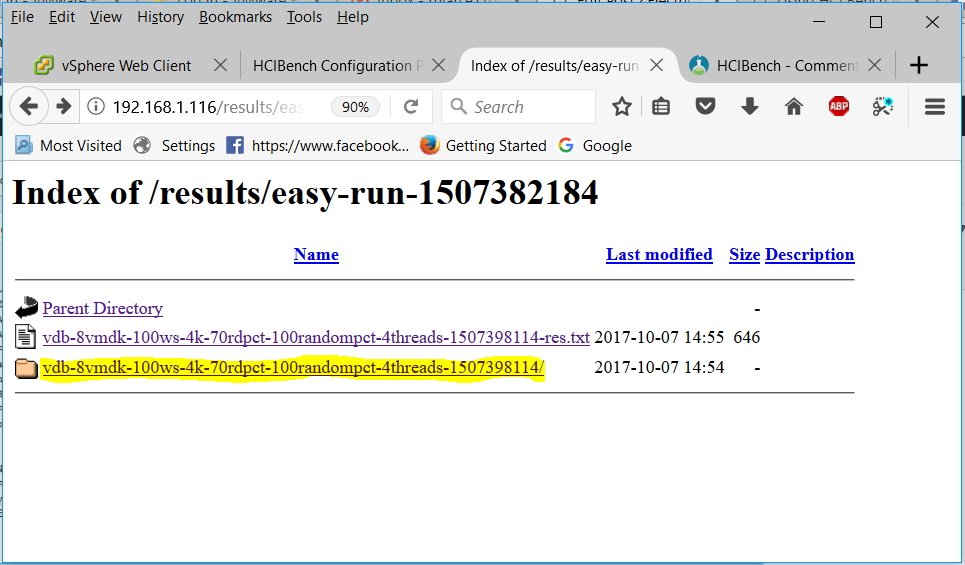
  • After the Vdbench testing finishes, the test results are collected from all Vdbench instances in the test VMs. And you can view the results at http://HCIBench_IP/results in a web browser and/or clicking the results button from the testing window.
  • You can also click Save Result and save a zip file of all the results
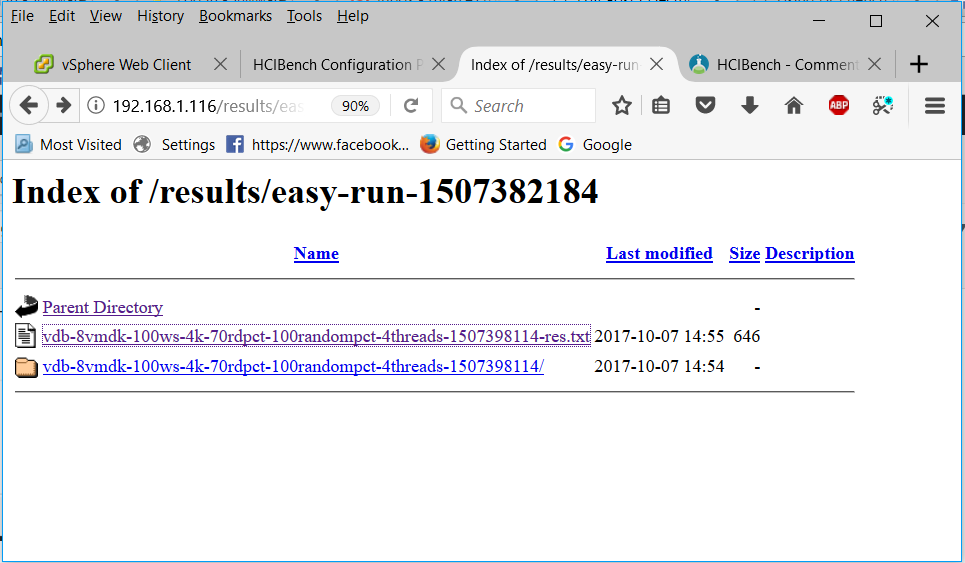
  • Click on the easy-run folder

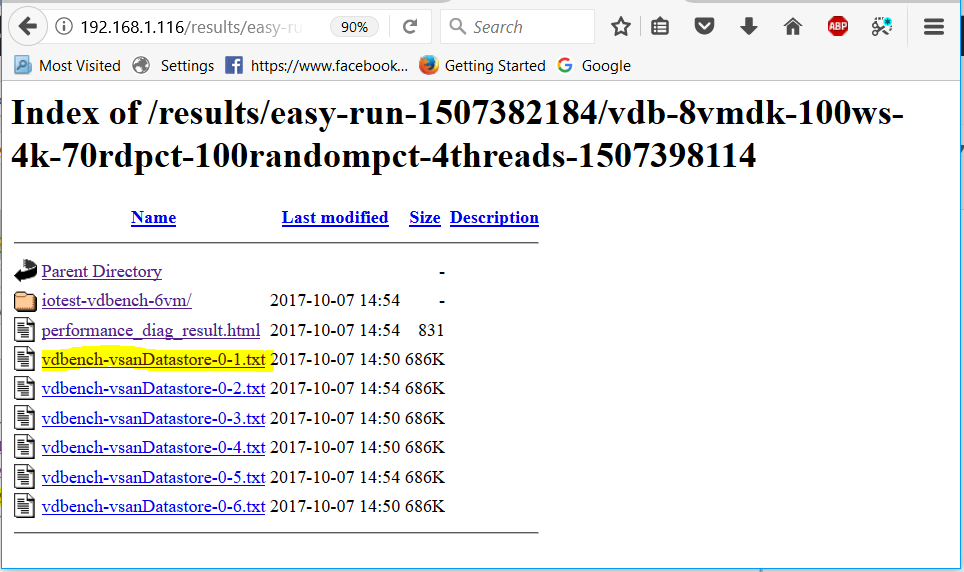
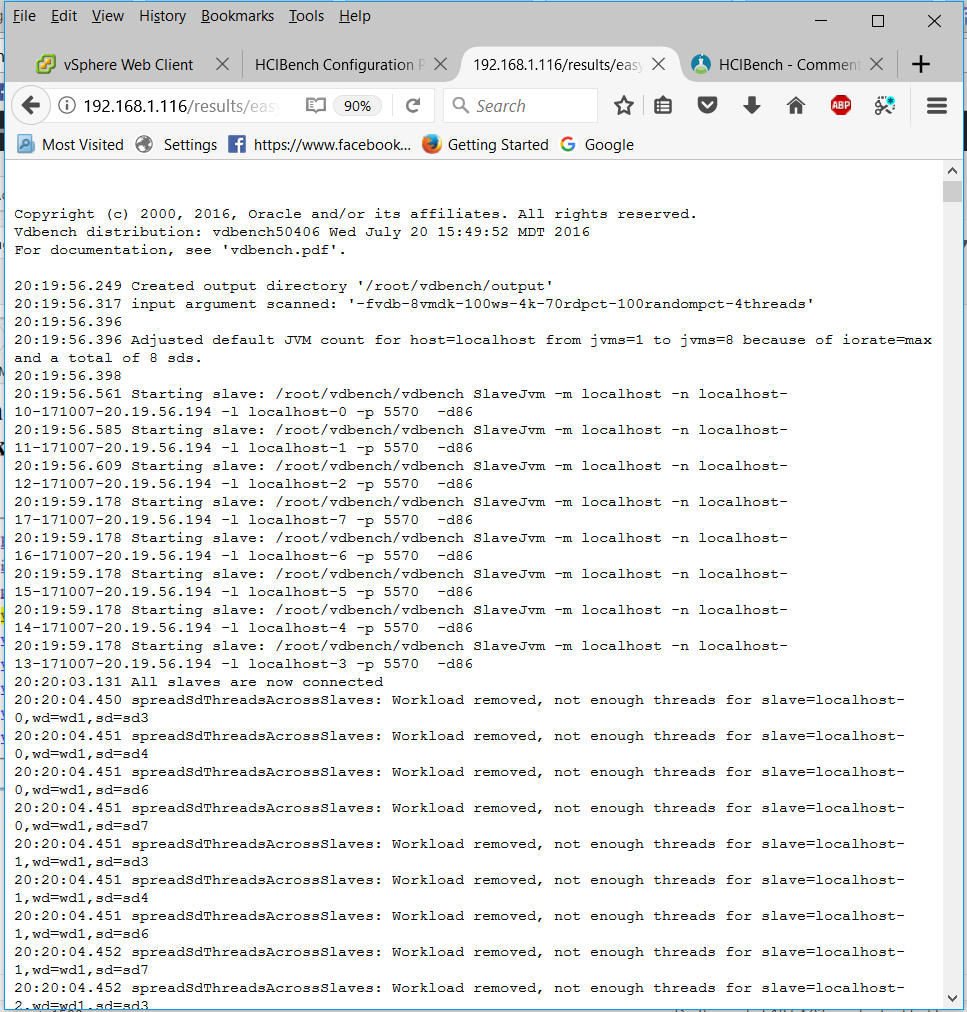
  • Click on the .txt file

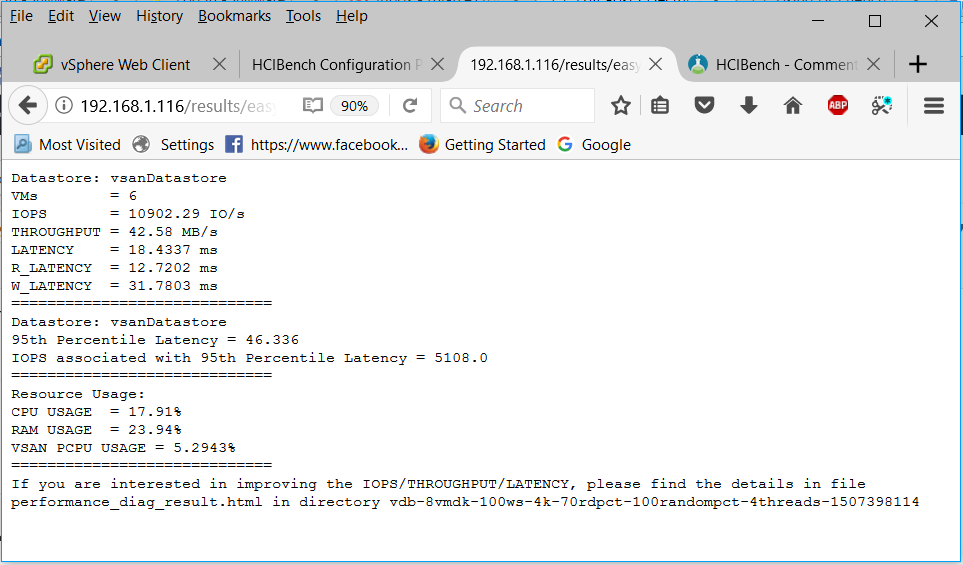
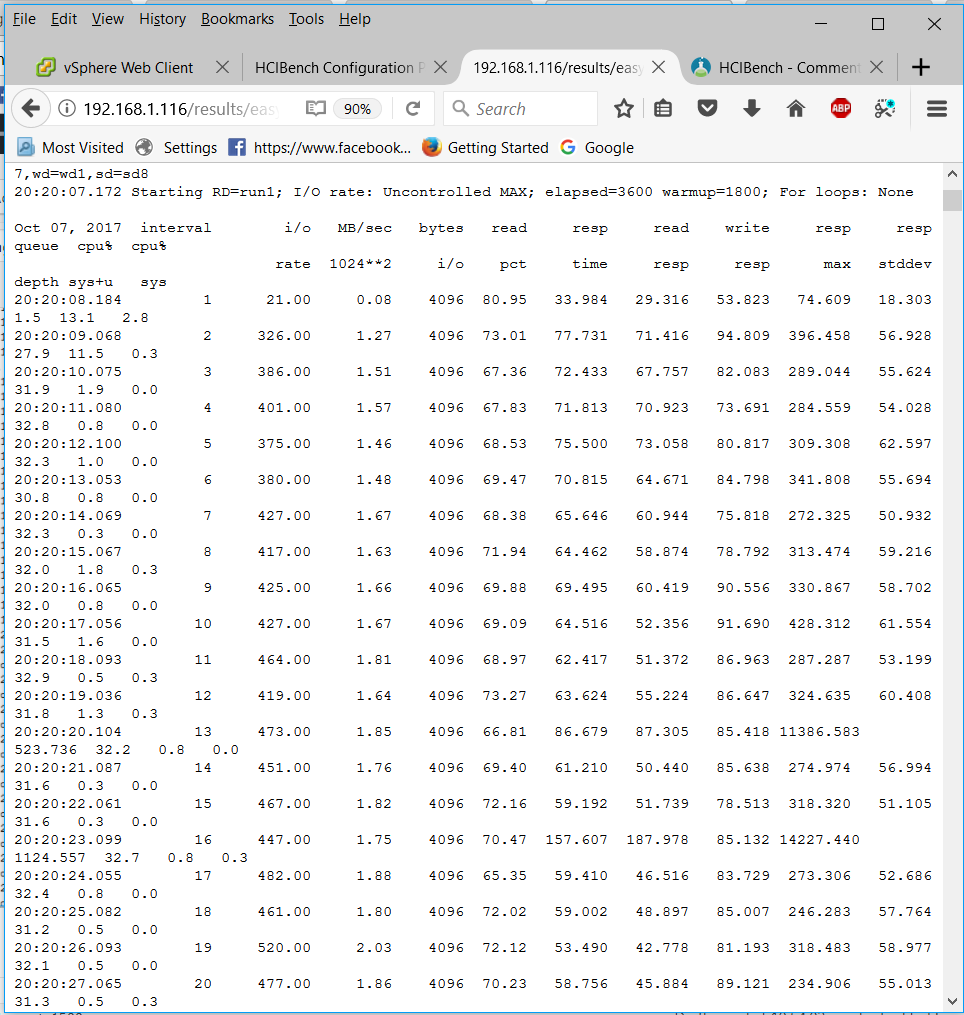
  • You will get a summarized results file

  • Just as a note in the output above, the 95th Percentile Latency can help the user to understand that during 95% of the testing time, the average latency is below 46.336ms
  • Click on the other folder

  • You can also see the individual vdBench VMs statistics by clicking on

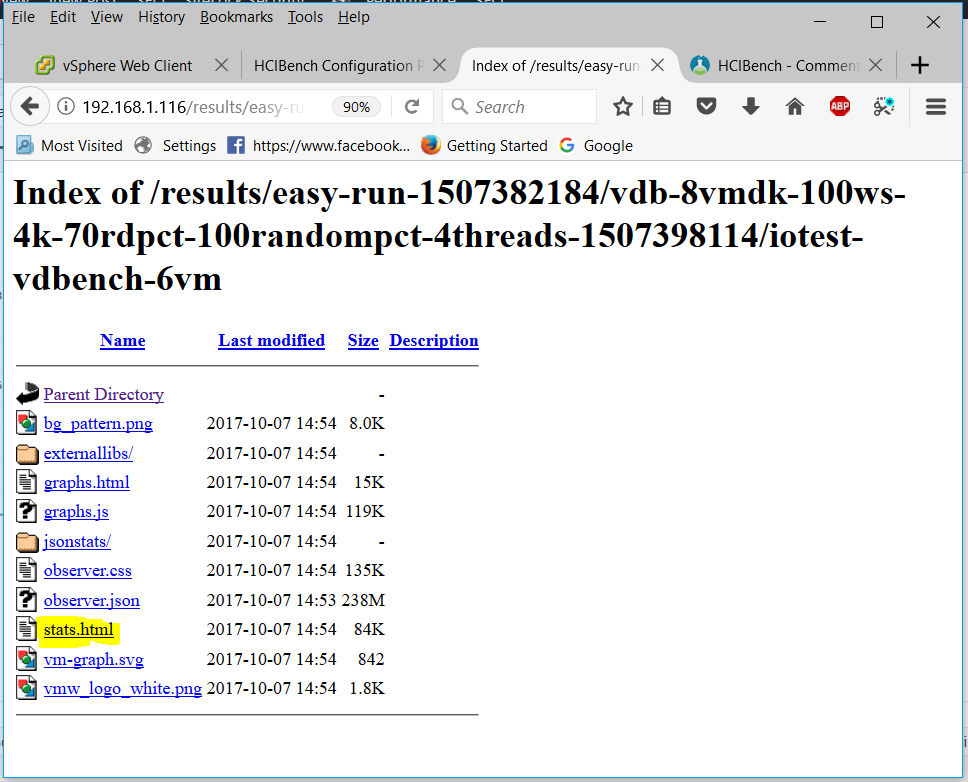
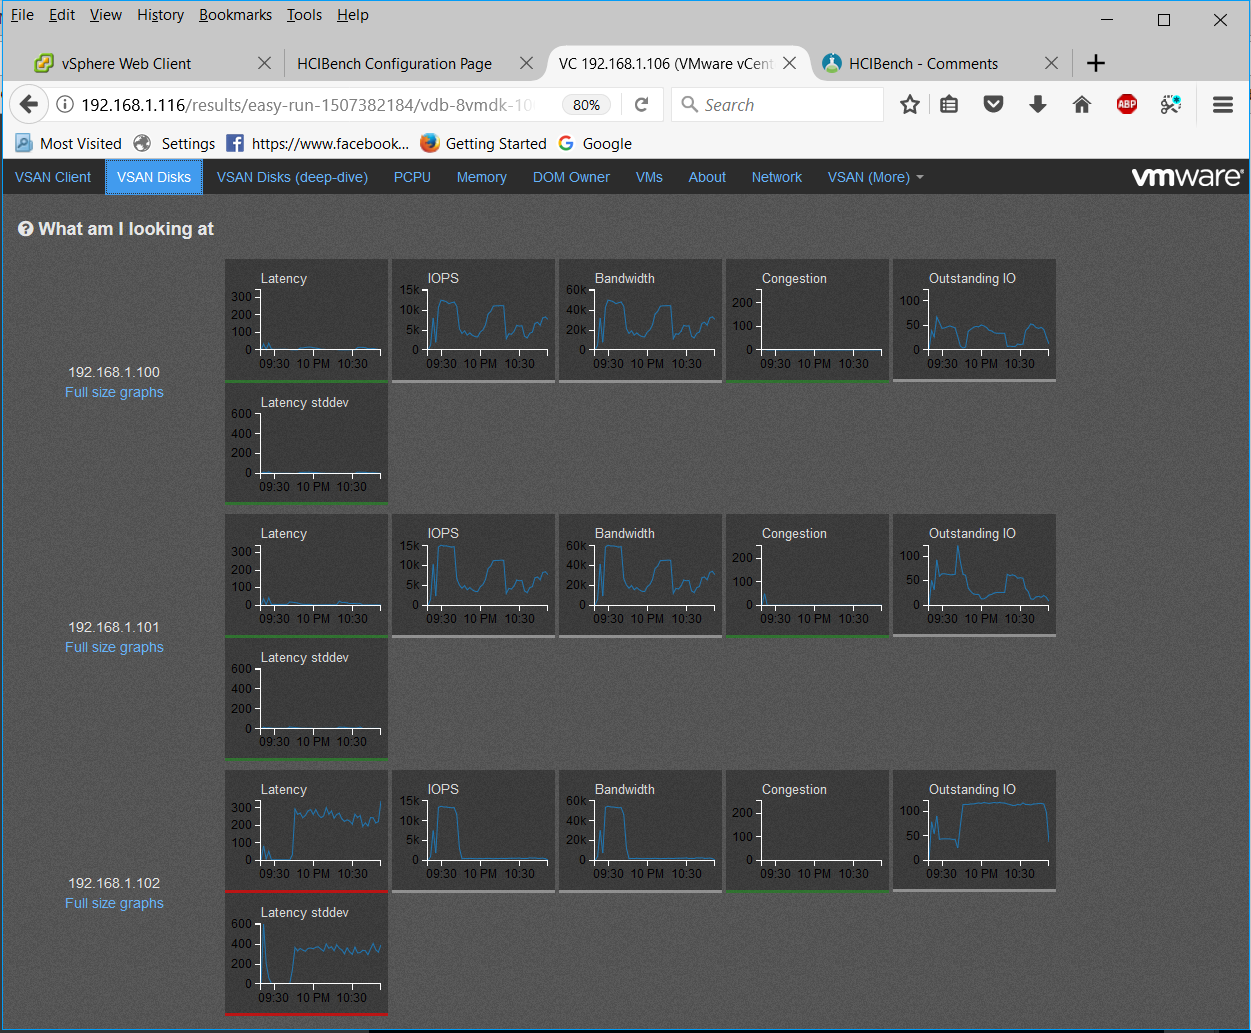
  • You can also navigate down to what is a vSAN Observer collection. Click on the stats.html file to display a vSAN Observer view of the cluster for the period of time that the test was running

  • You will be able to click through the tabs to see what sort of performance, latency and throughput was occurring.

  • Enjoy and check you are getting the results you would expect from your storage
  • The results folder holds 200GB results so you may need to delete some results if it gets full. Putty into the appliance, go to /opt/output/results and you can use rm -Rf “filename”

Useful Links

  • Comments from the HCIBench fling site which may be useful for troubleshooting

https://labs.vmware.com/flings/hcibench/comments

  • If you have questions or need help with the tool, please email VSANperformance@vmware.com
  • Information about the back-end scripts in HCIBench thanks to Chen Wei

https://blogs.vmware.com/virtualblocks/2016/11/03/use-hcibench-like-pro-part-2/

An interesting point about VMs and O/S alignment – Do we still need this on vSAN and are there performance impacts?

https://blogs.vmware.com/vsphere/2014/08/virtual-san-block-alignment.html


Backup and Restore of VCSA 6.5

Backing up and Restoring VCSA

Backup steps

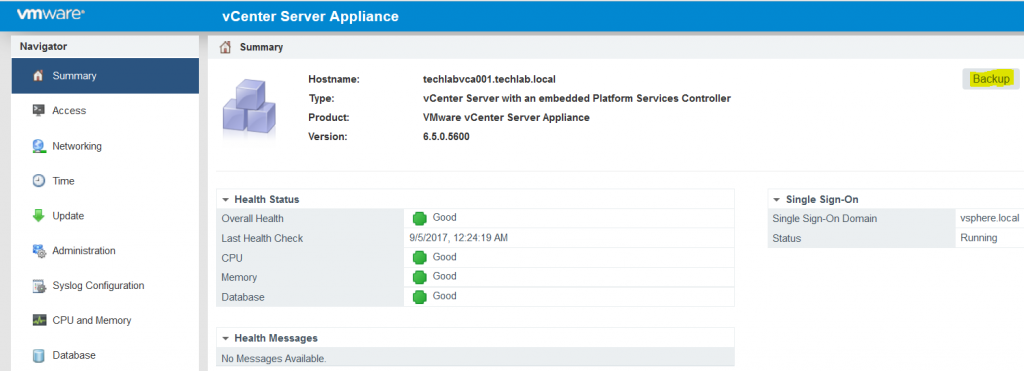
  • Log into the VCSA appliance screen. In my case https://192.168.1.106:5480
  • Select Backup from the Summary Screen

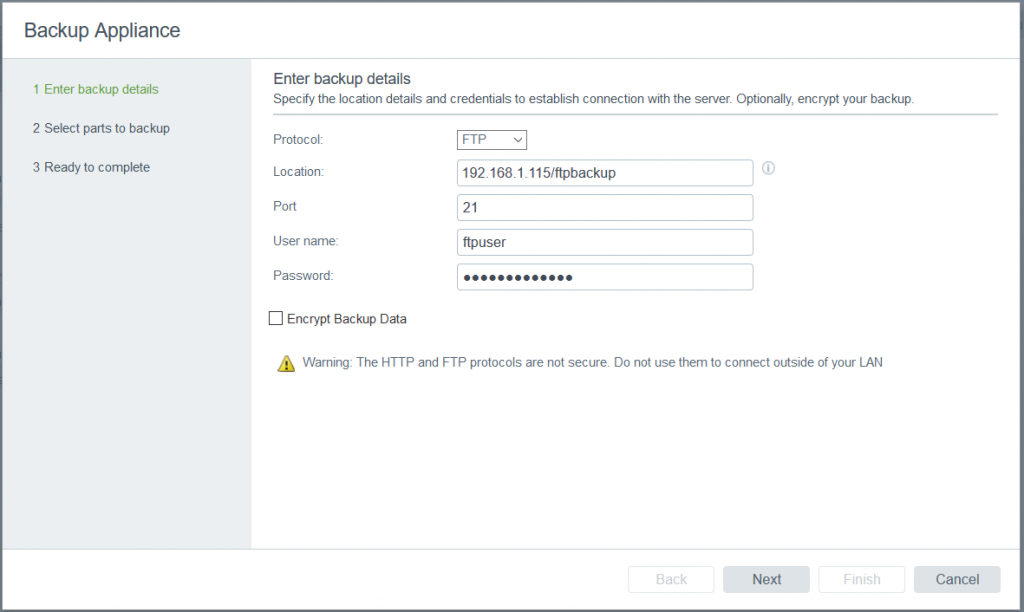
  • Put in the backup details. As a test I have set up a Filezilla FTP server on a Windows box to use as my backup location

You can choose to optionally encrypt the backup with a password. This uses AES256 encryption

  • Click Next and it will validate the inputs

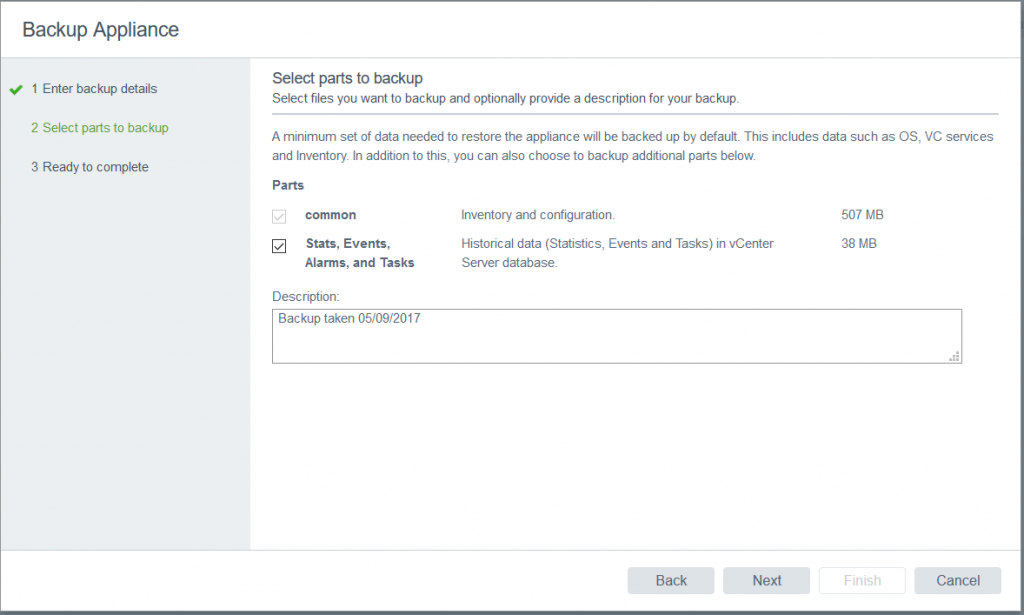
  • Choose what to backup

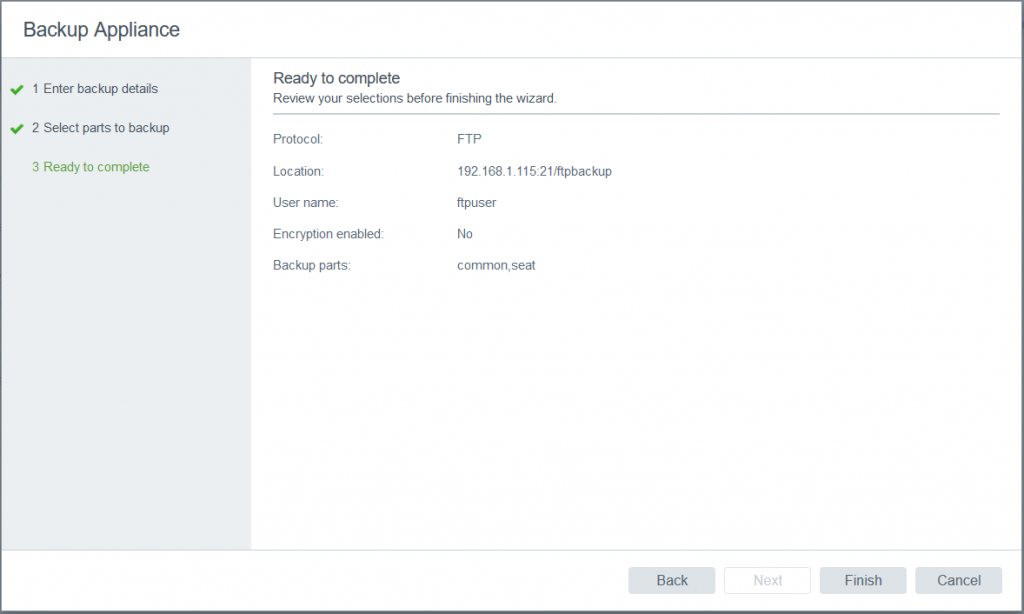
  • Click Next and Complete the Backup

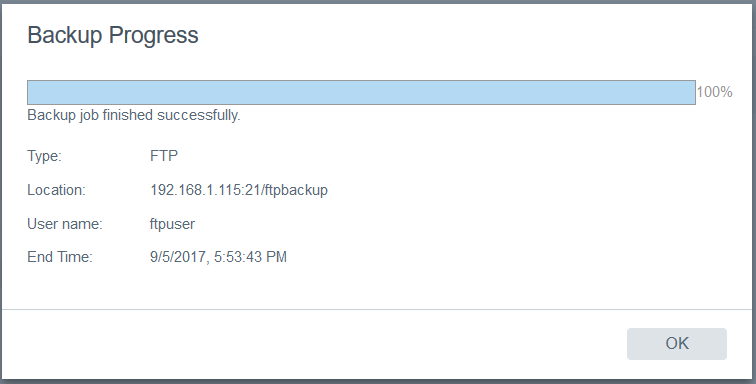
  • The Backup should run and complete successfully

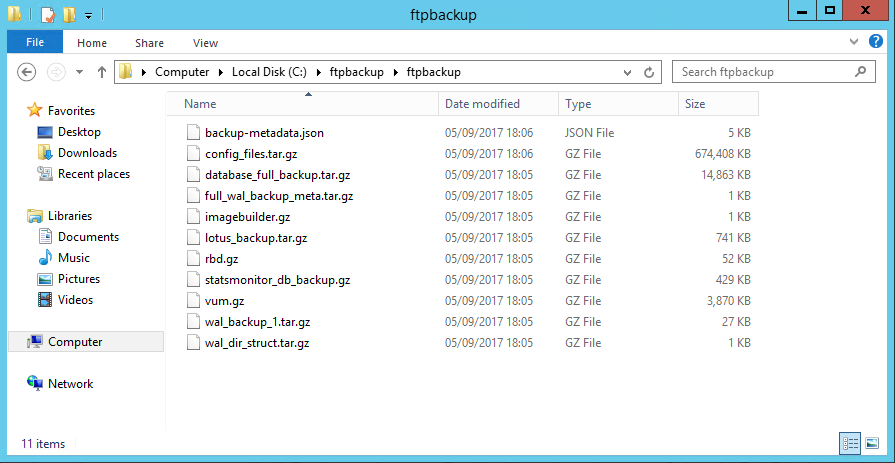
  • Check the backup files exist in the ftp directory you specified

Restoring a VCSA 6.5 appliance

The one thing to remember is that is my lab environment. I am going to power off and unregister my current VCSA to simulate that there has been an unrecoverable failure as I am going to need to restore an identical named and IP addressed machine. Obviously you can’t have 2 VMs registered with the same name in the inventory or the same IP address so I have temporarily shutdown and unregistered my current VCSA.

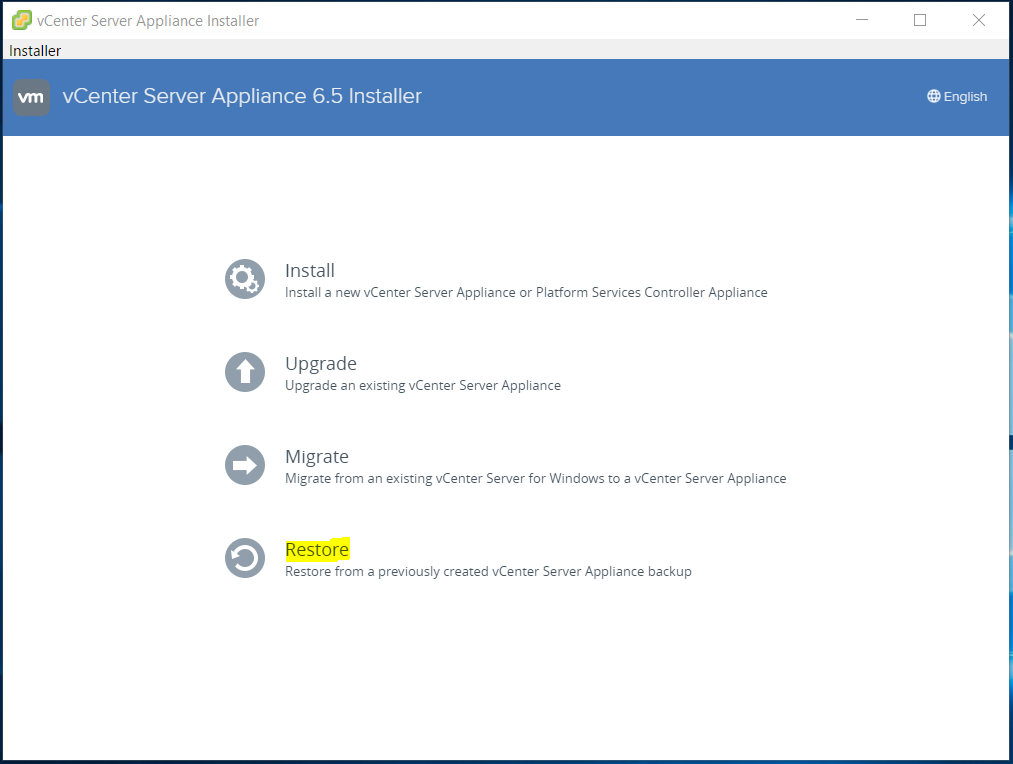
  • Mount the vCSA installer ISO and run installer.exe from \vcsa-ui-installer\win32 assuming you’re running this on Windows.
  • Click Restore

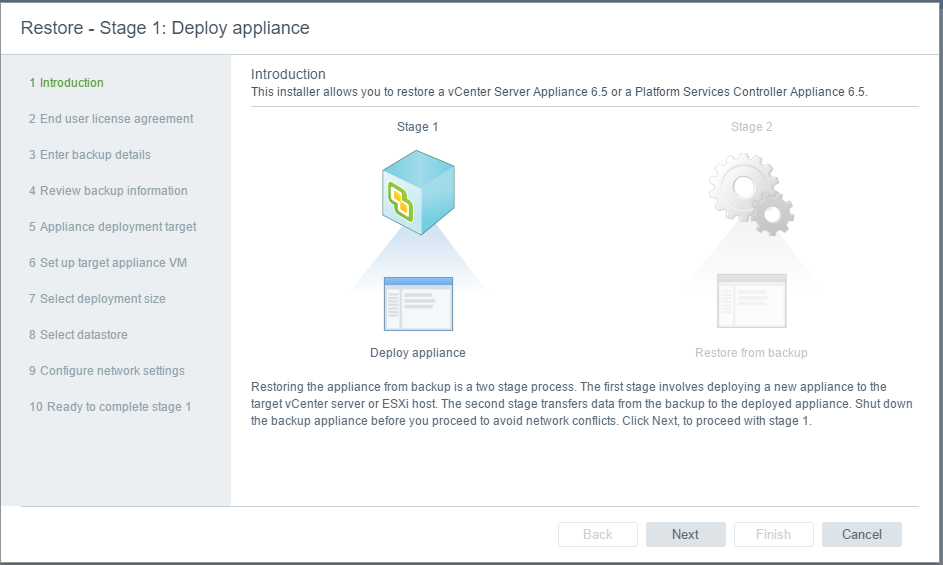
  • The Restore Wizard will start and you will see the below screen
  • Click Next

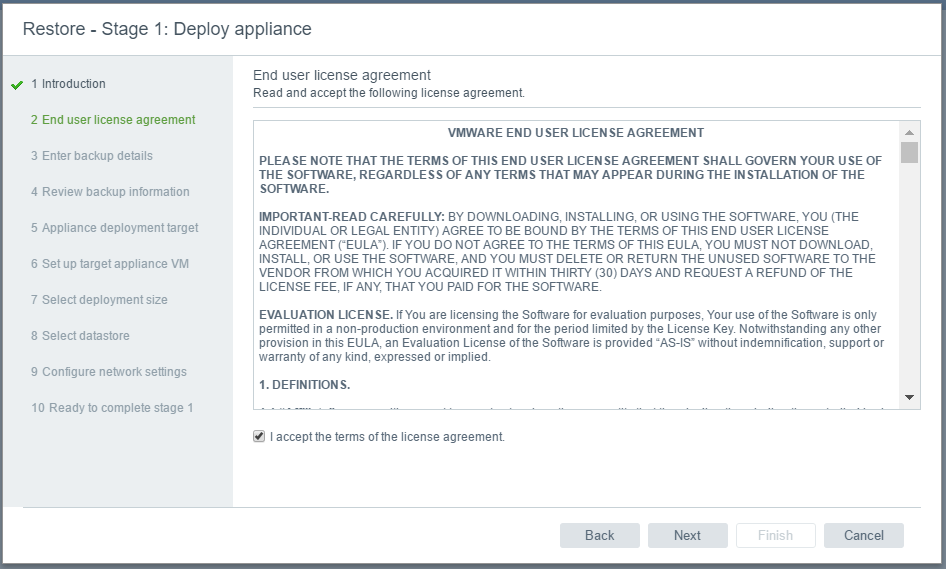
  • Accept the License Agreement

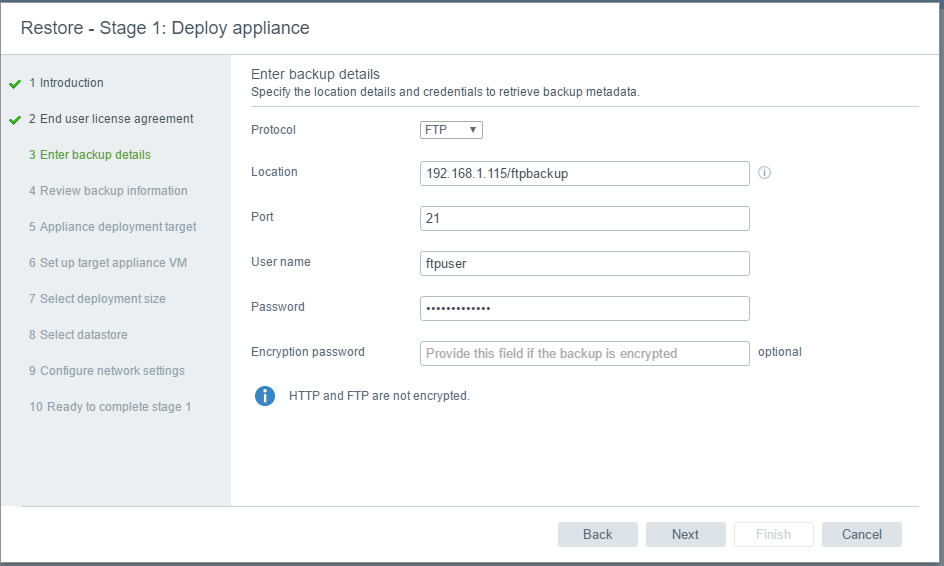
  • Fill in the details for the backup file

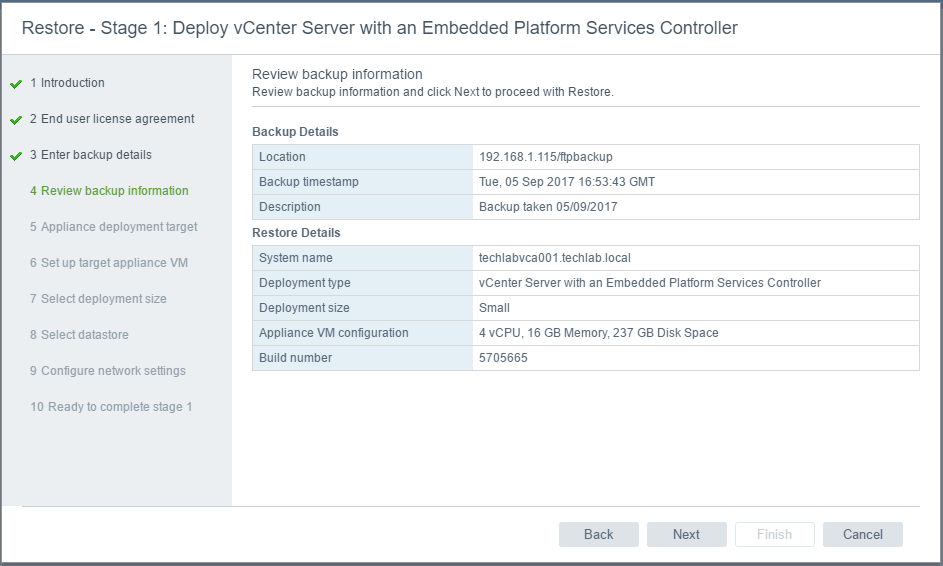
  • Check the details

  • Click Next
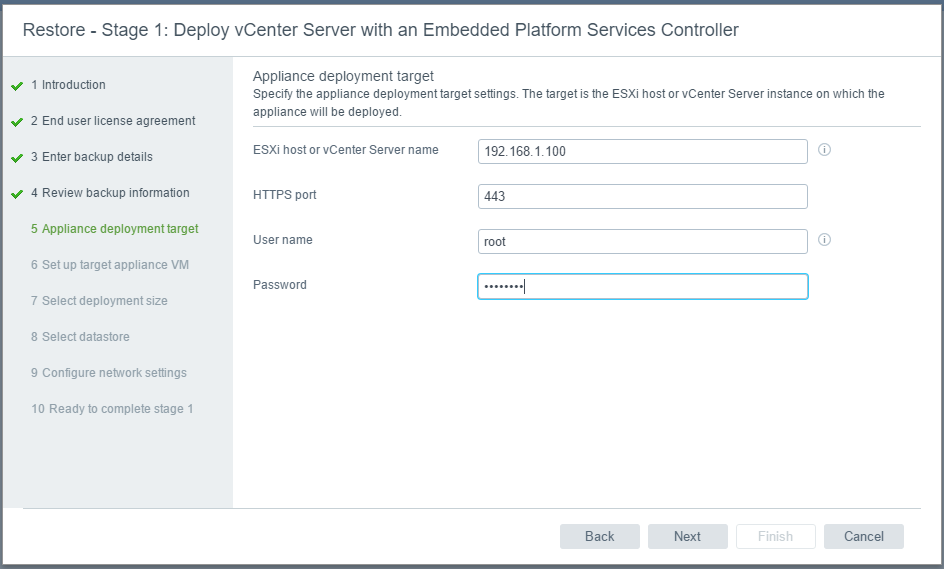
  • Put in the host details for deploying the new VCSA

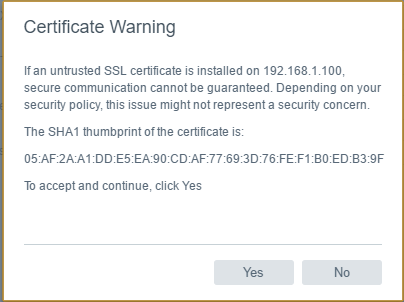
  • Accept the Certificate

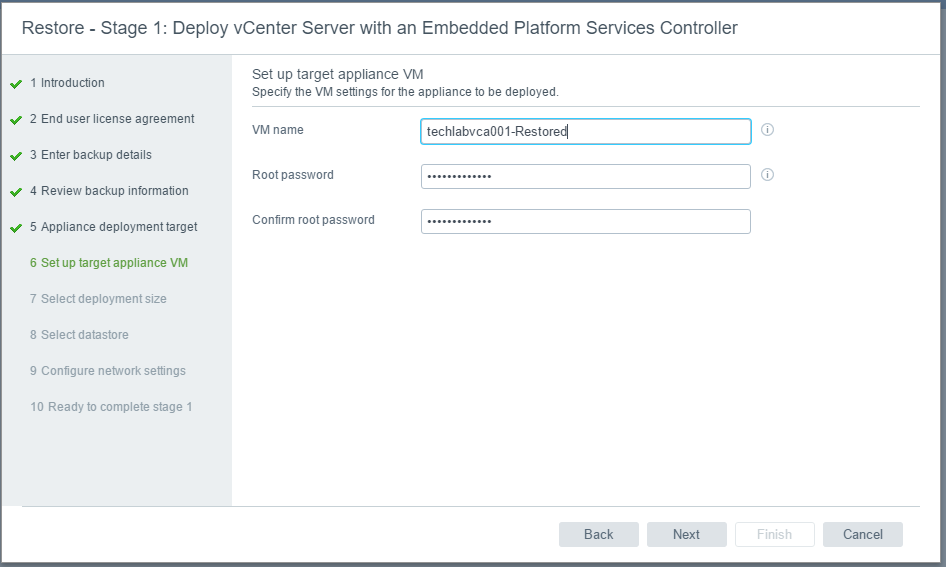
  • Set up the target appliance VM

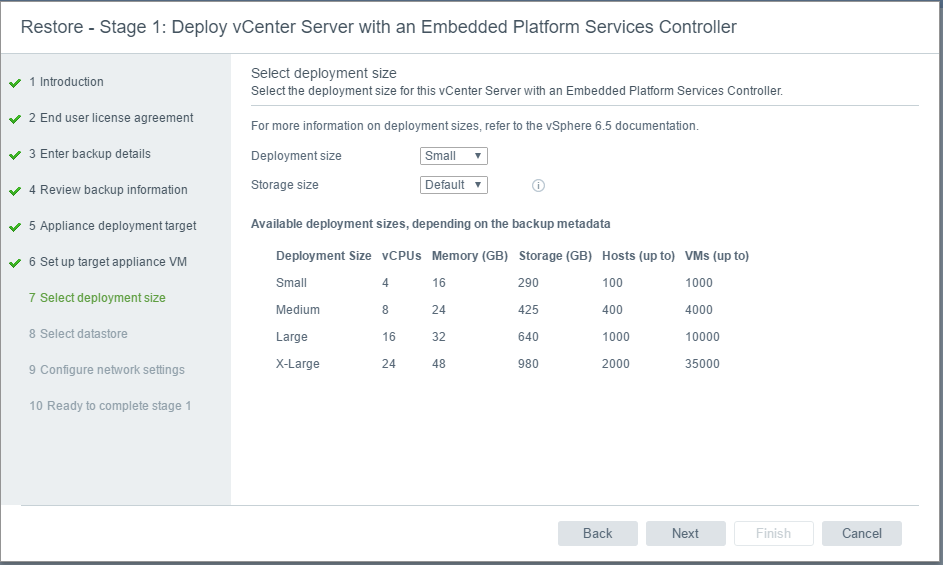
  • Set the deployment size

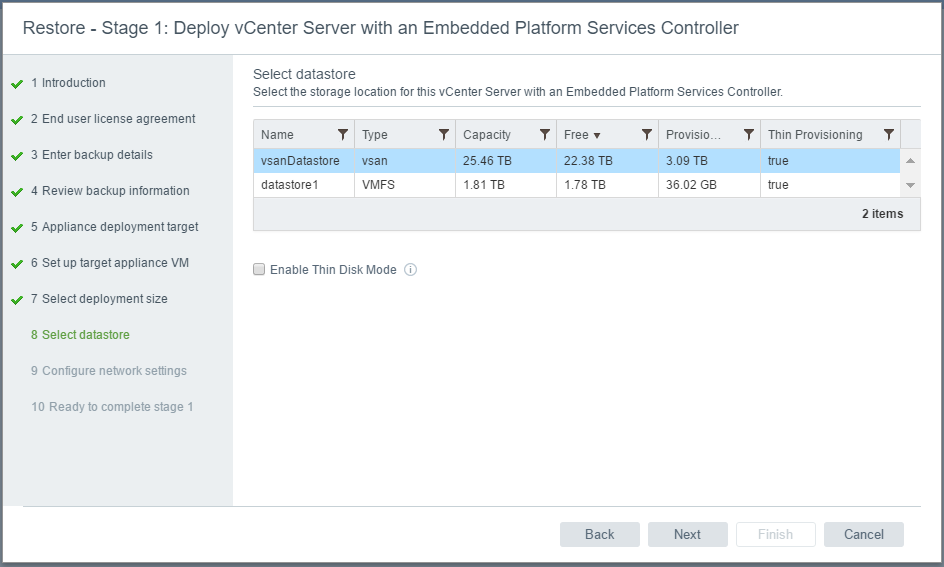
  • Select the datastore to restore to. In my case I have a vSAN or a Local datastore to restore to

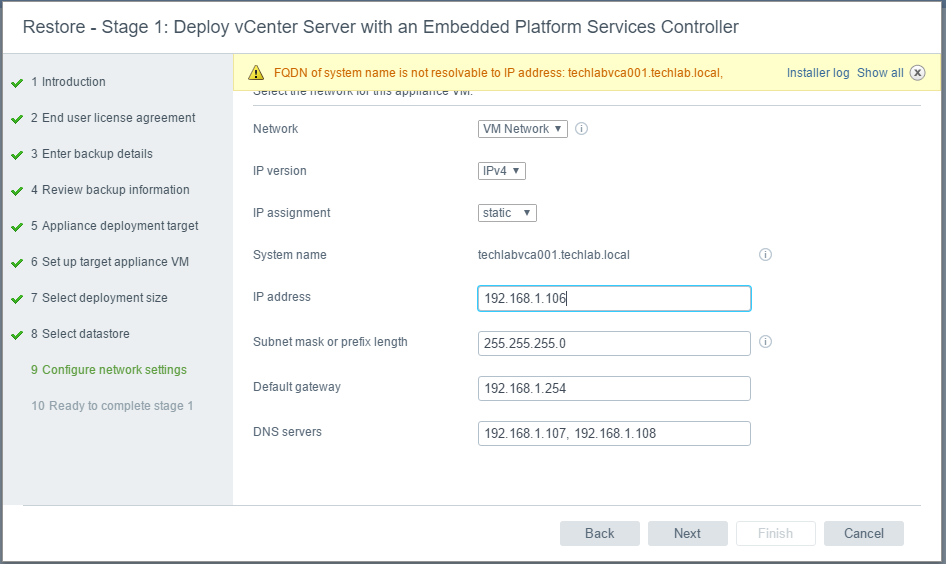
  • Enter the IP Address details.

  • Click Next
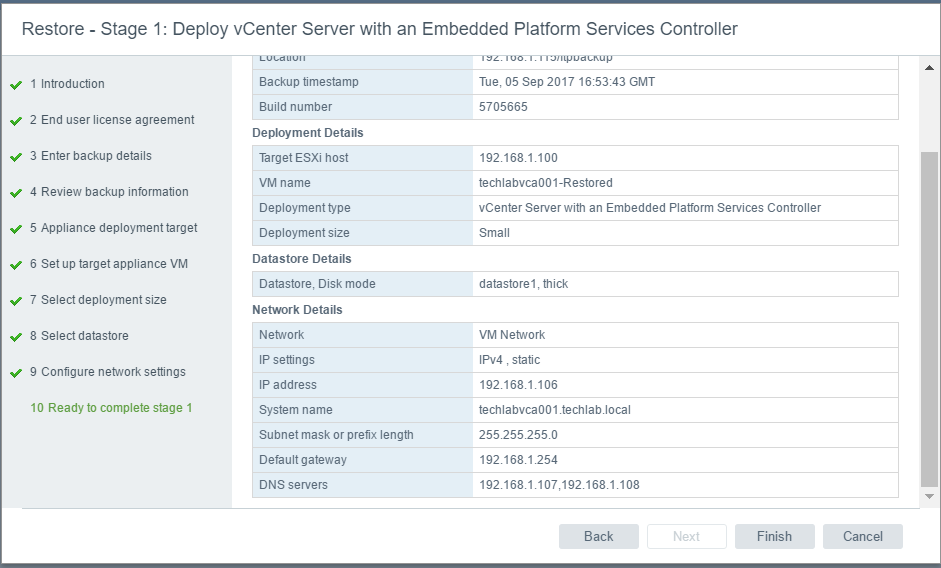
  • Check the Details and click Ready to Complete

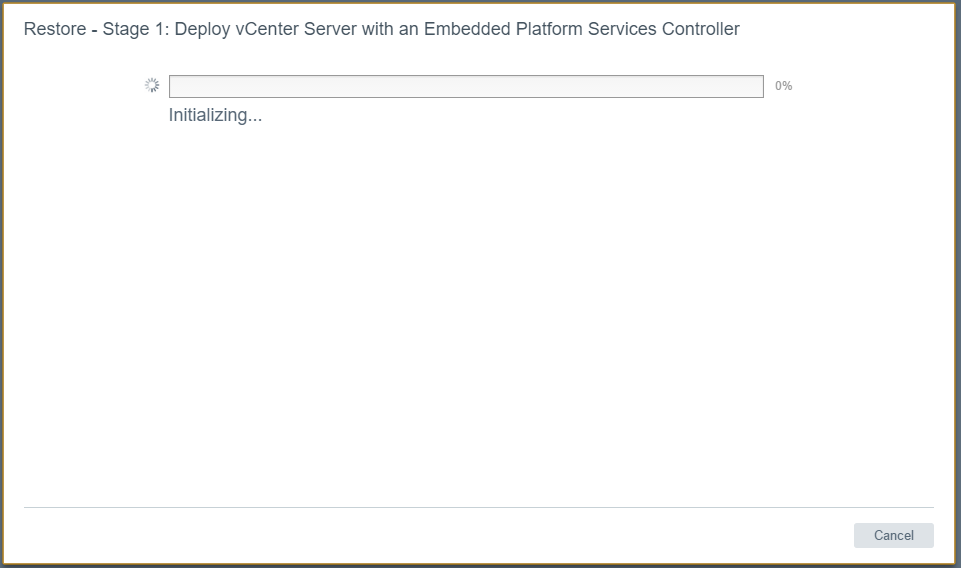
  • It will say initializing

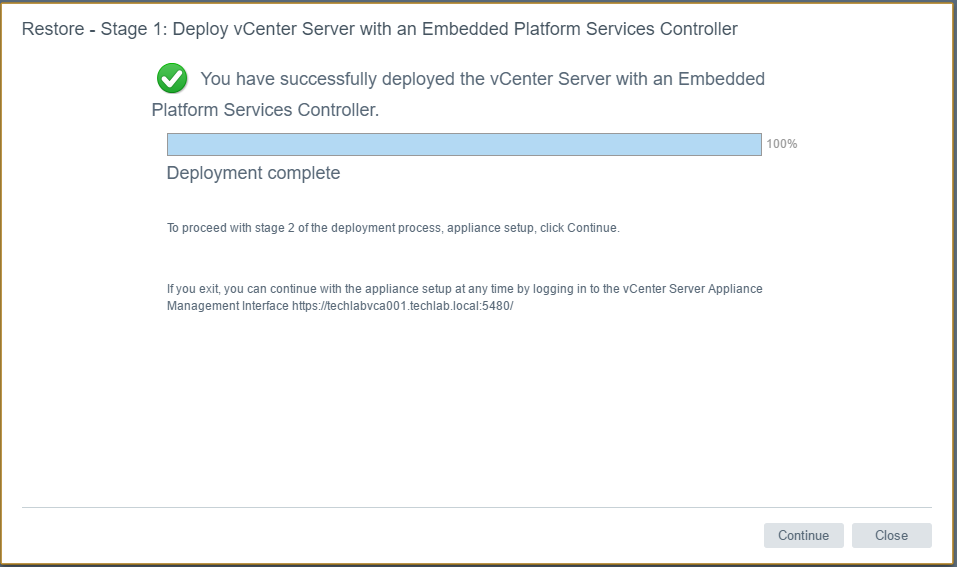
  • It will finally complete and should say

  • Click Continue

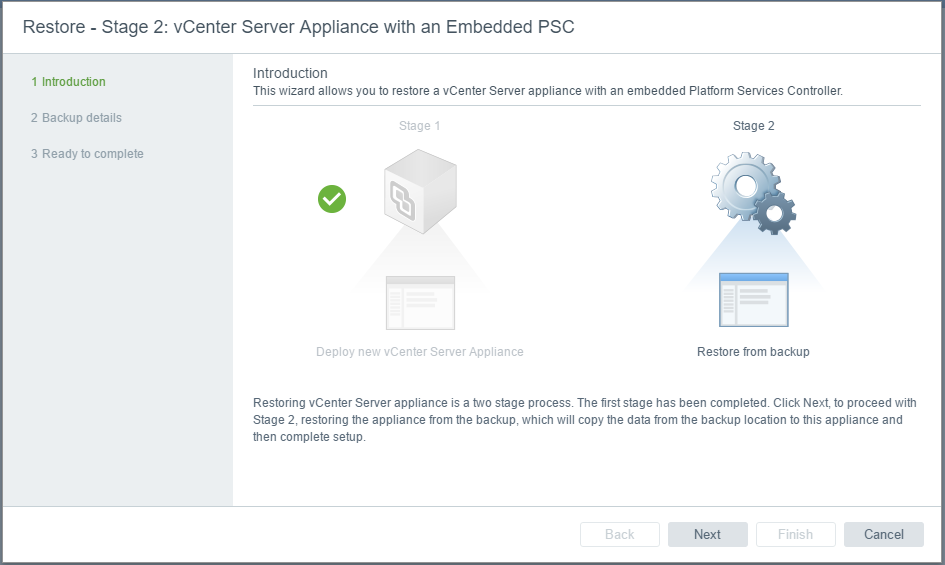
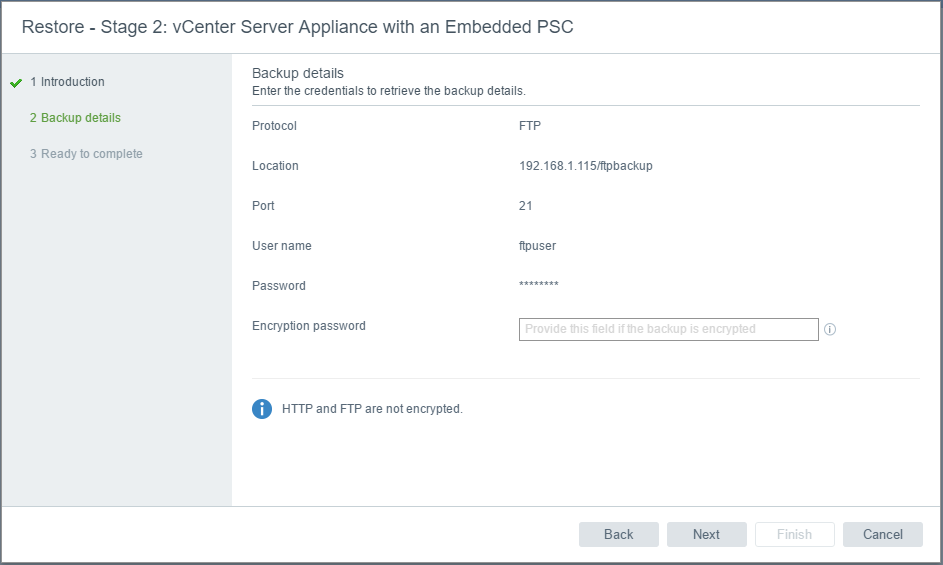
  • Check the details

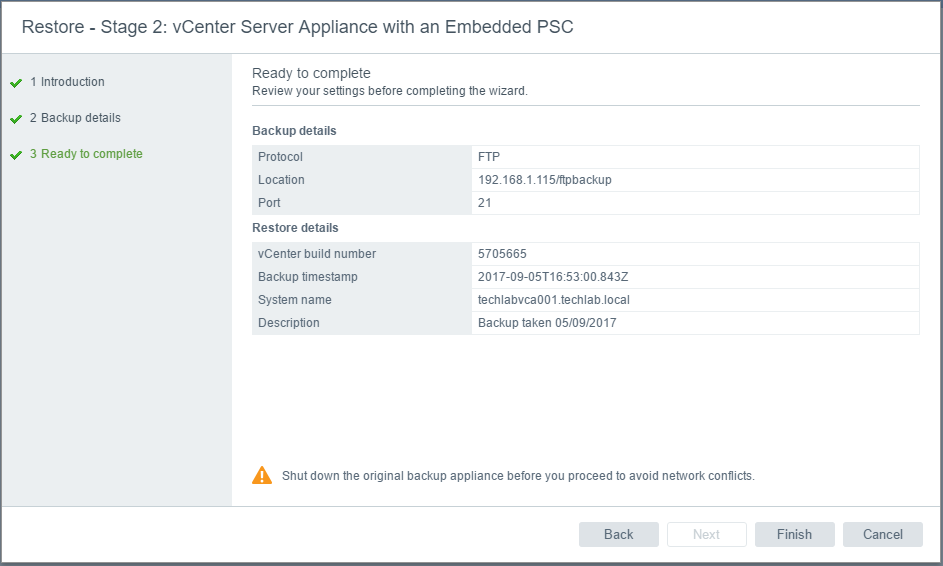
  • Complete the second stage of the restore

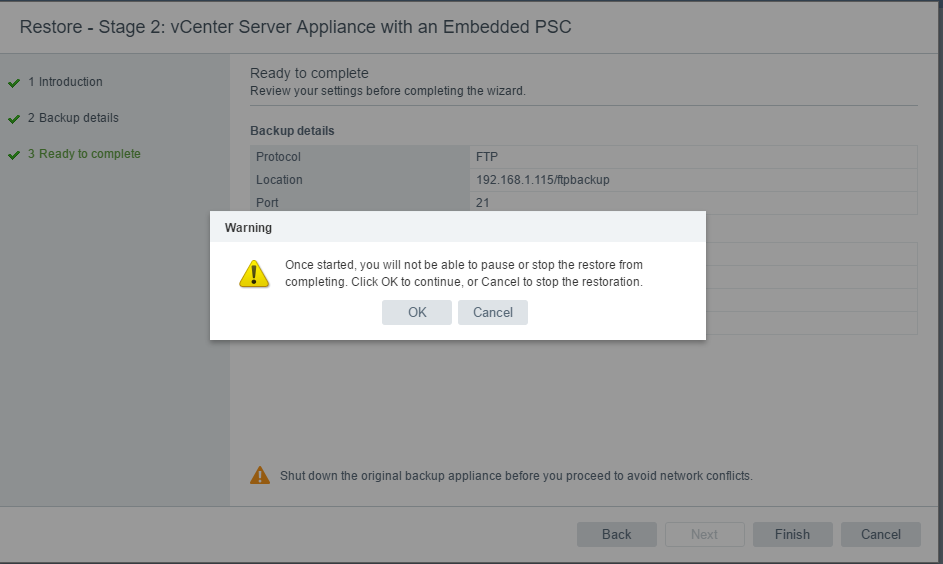
  • Take note of the warning

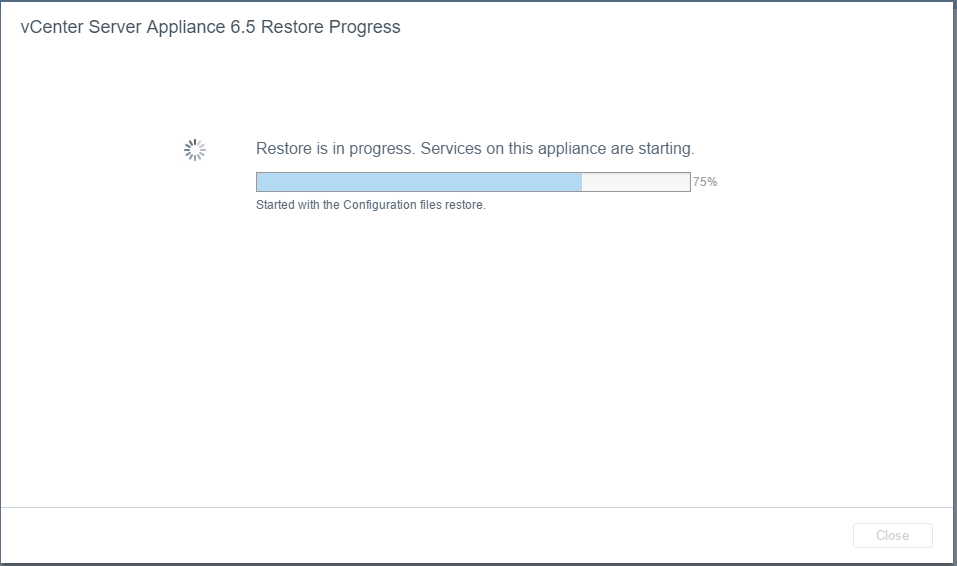
  • The restore should start

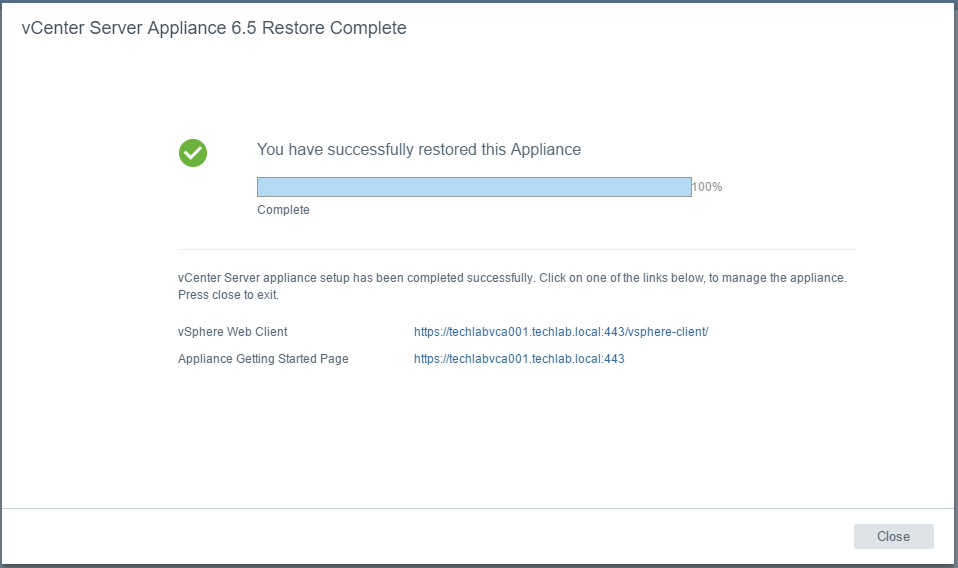
  • Once the restore has fully finished, you should see the below screen

  • Check the host for the newly restored VCSA

Useful Links

3 x Dell Poweredge T710 lab with a bootstrapped install of vCenter 6.5, embedded PSC and vSAN 6.6

vCenter 6.5/vSAN 6.6 new install

This is a blog based on my Dell Poweredge T710 lab which I’ve set up to take advantage of testing vSphere 6.5 and vSAN 6.6 as a combined install of a new installation which should bootstrap vSAN, create a vCenter and then place the vCenter on the vSAN automatically.

Note: vSAN will be a hybrid configuration of 1 x SSD and 6 SATA hot plug drives per server.

New integrated bootstrapping feature explained

In some environments where new hardware being deployed, high availability shared storage may not be accessible during day-zero installation meaning if you were building a greenfield deployment, it was almost a catch 22 scenario. How did you build your vSAN with a vCenter server when you only had the disks for a vSAN deployment. There were ways around this via command line but it has now been built into the functionality of vSphere 6.5/vSAN 6.6.

Local disk, if available, can be used as a temporary location for vCenter installation, but vCenter migration after bringing up the cluster could be time consuming and error prone. Bootstrapping vSAN without vCenter can solve this problem and remove the requirement to have high availability storage or temporary local disk at day-zero operations. This could be applicable to a greenfield deployment scenario. With the Bootstrapping vSAN method, a vSAN based datastore can be made available at day-zero operation to bring-up all management components.

Lab Setup

3 x Dell Poweredge T710 servers each with

  • 2 x 6 core X5650 2.66Ghz processors
  • 128GB RAM
  • 6 x Dell Enterprise 2TB SATA 7.2k hot plug drives
  • 1 x Samsung 256GB SSD Enterprise 6.0Gbps
  • Perc 6i RAID BBWC battery-backed cache
  • iDRAC 6 Enterprise Remote Card
  • NetXtreme II 5709c Gigabit Ethernet NIC

Initial Steps for each 3 hosts

  • The Perc 6i controller is not on the vSAN HCL but vSAN can still be setup using RAID0 passthrough which involves configuring a RAID0 volume for each drive in the BIOS (Ctrl + R at bootup) Always make sure the drive is initialized in the BIOS which clears any previous content because vSAN requires the drives to be empty. Press Control > R during boot up and access the Virtual Disk Management screen to create disks as RAID0. See the link below for full information

https://community.spiceworks.com/how_to/8781-configuring-virtual-disks-on-a-perc-5-6-h700-controller

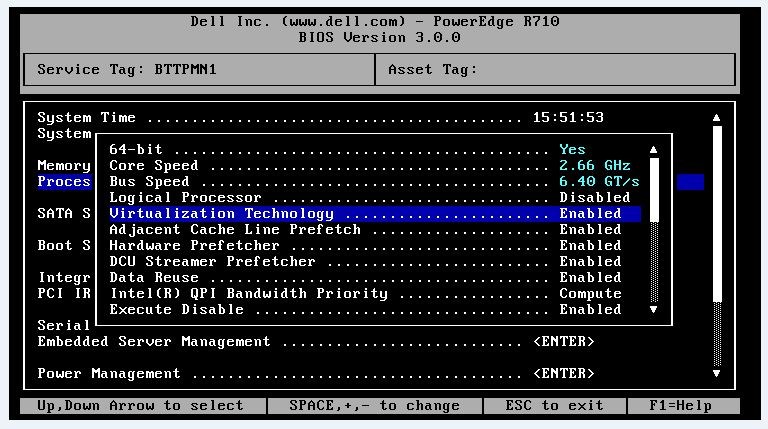
  • In the System Setup BIOS screen you will need to enable Virtualization Technology.  Not enabled by default and will stop any VMs from powering on if not enabled

  • Make sure you have an AD/DNS Server with entries for your hosts and vCenter
  • Put in your license keys
  • Disks may not come up marked as SSD. In this case I had to run the following commands on each server (Replace your disk naa id with yours and the SATP Type)

Find your disk information as per below command but you can also find the disk ID’s in the host client

https://kb.vmware.com/selfservice/microsites/search.do?language=en_US&cmd=displayKC&externalId=2013188

  • Your SSD disks should then come up marked as SSD. I didn’t have to reboot.

Install the vCenter Appliance

  • Make sure you have the software downloaded. I’m using the VMware-VCSA-all-6.5.0-5705665.iso
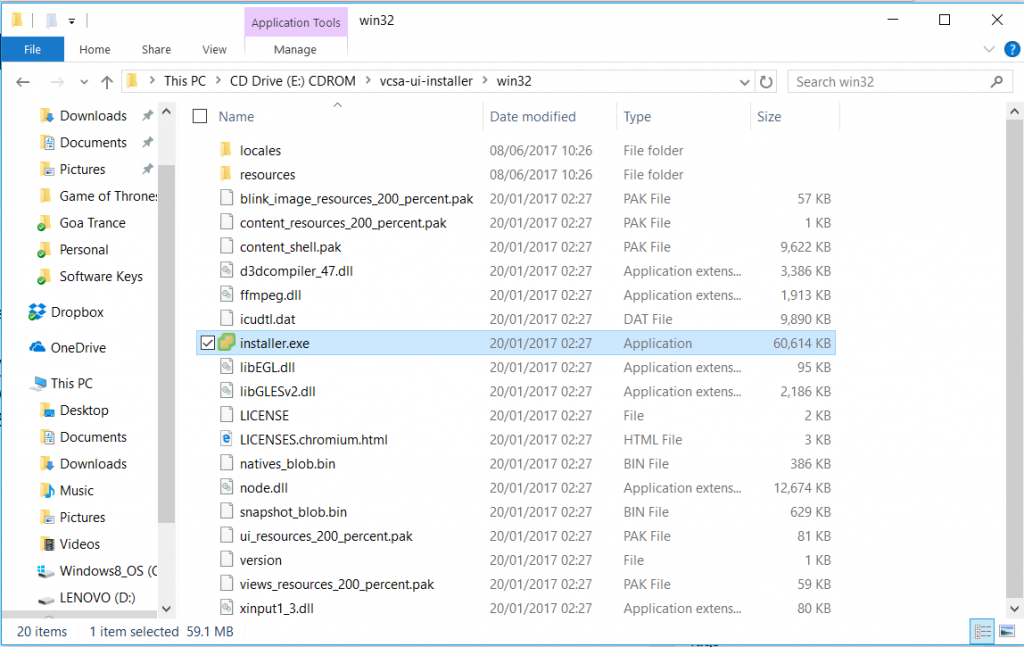
  • On another machine, mount the VMware-VCSA-all-6.5.0-5705665.iso. I connected this to my Windows 10 laptop as a virtual drive. Start the vCenter Server Appliance 6.5 installer located at \vcsa-ui-installer\win32

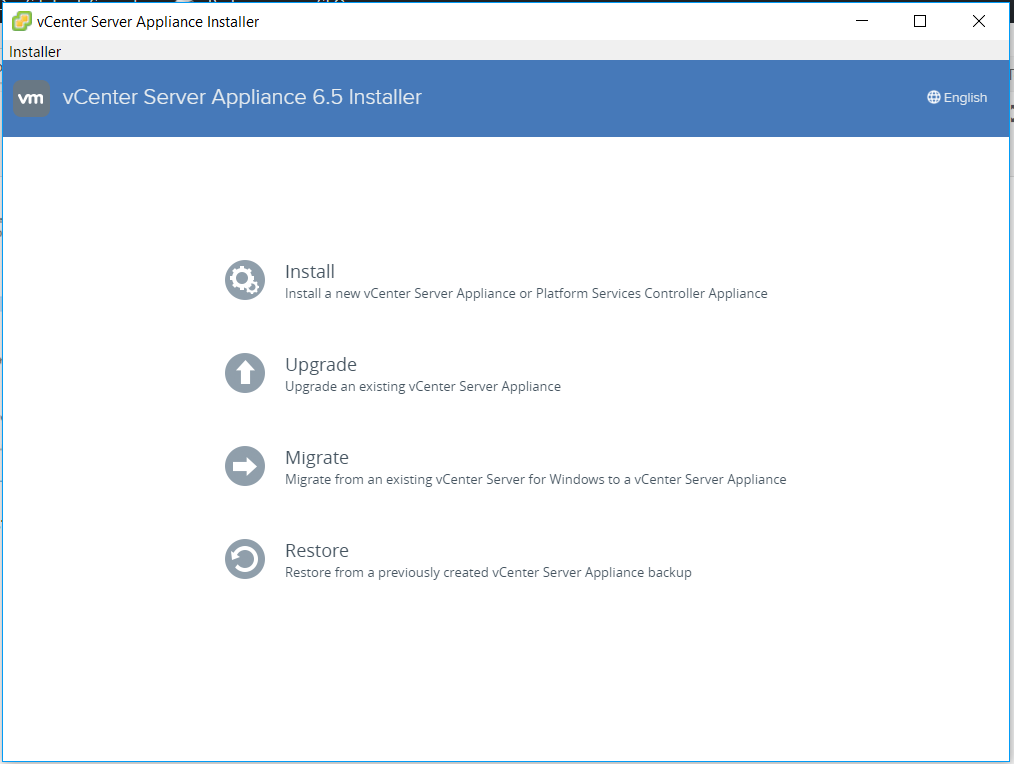
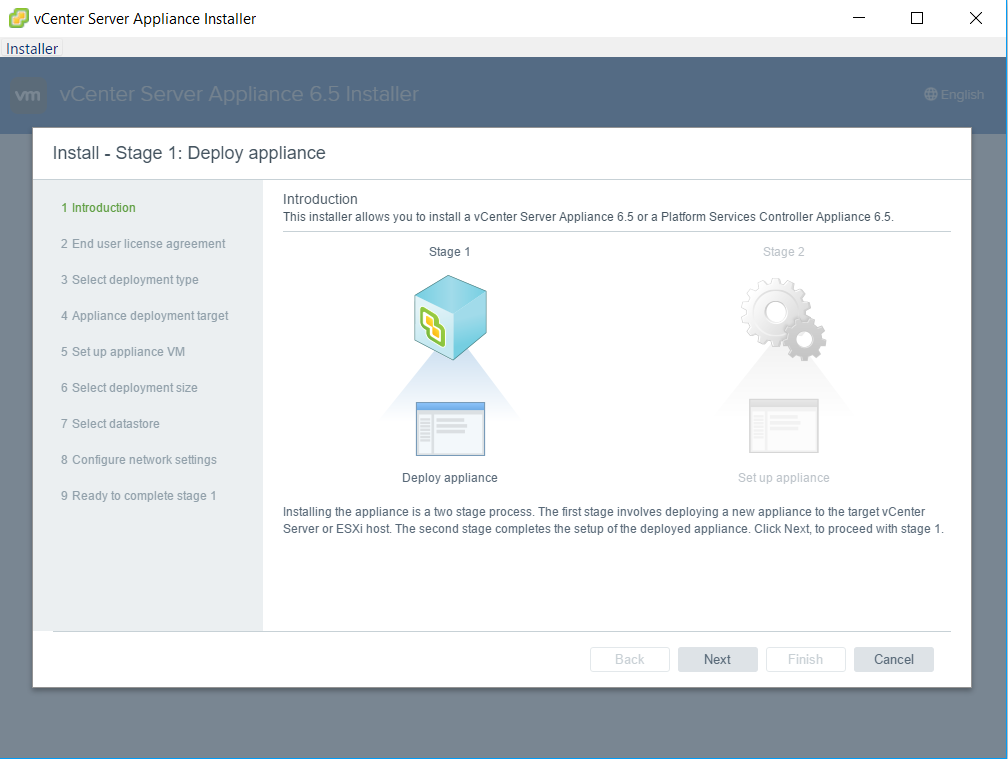
  • Select Install from the VMware vCenter Server Appliance 6.5 Installer.

  • You will see the Introduction screen

  • Accept the License Agreement
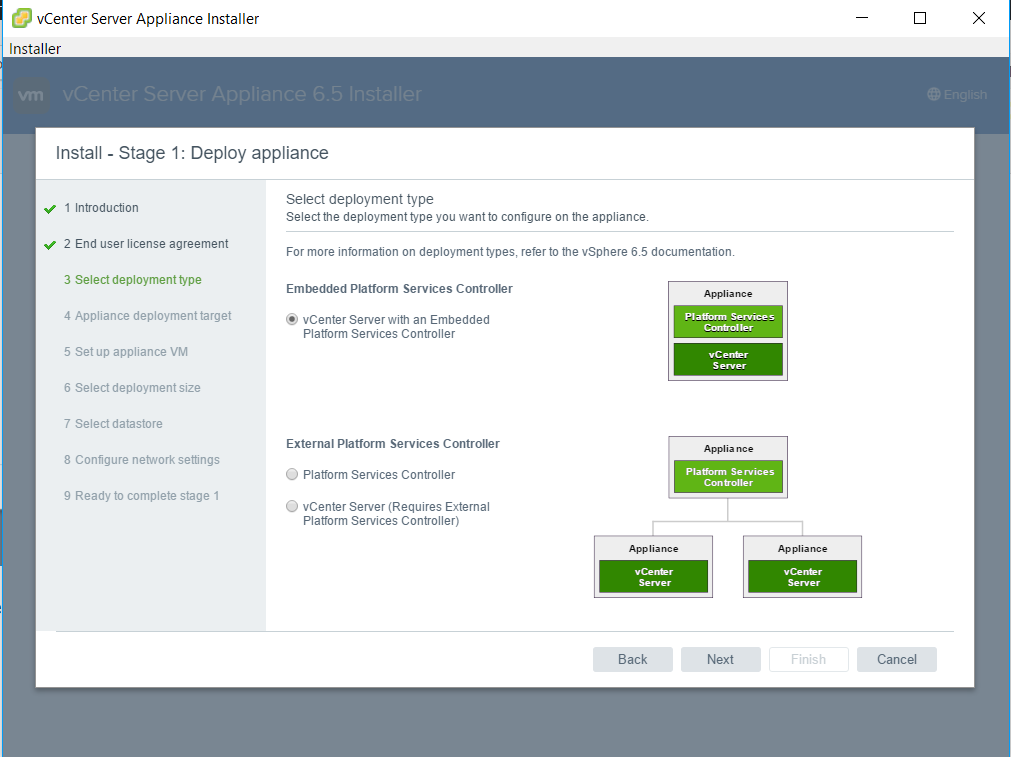
  • Select Deployment Type. For now I’m going to use an embedded Platform Service Controller

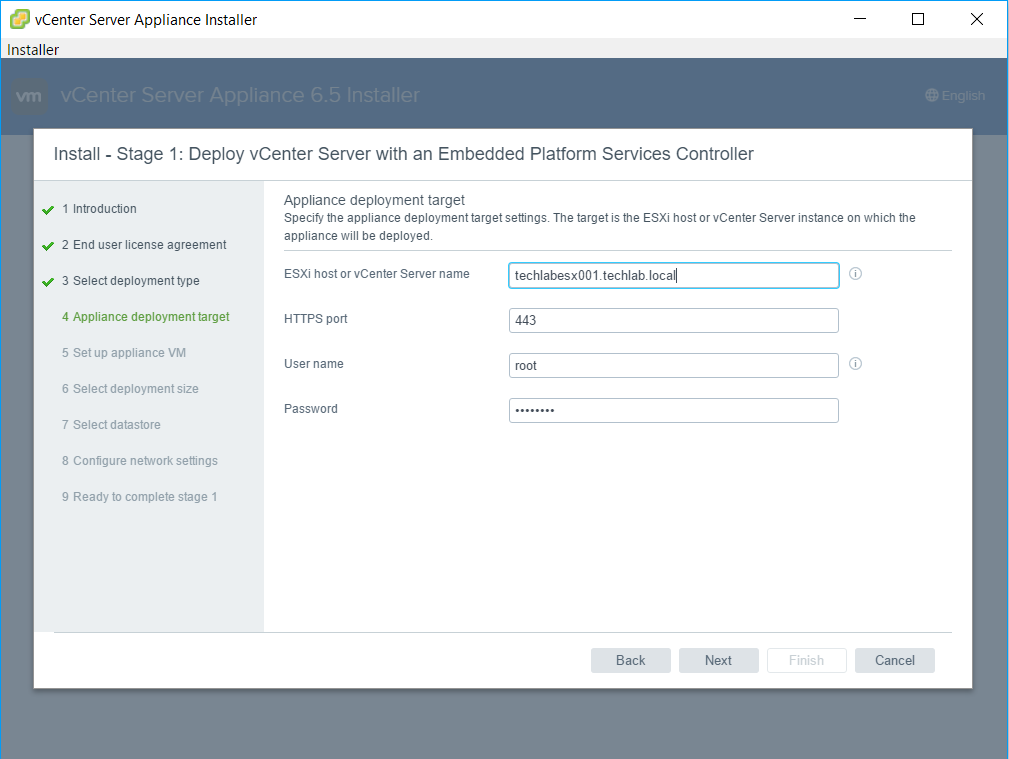
  • Enter the details for the appliance target. Try an IP Address if a FQDN doesn’t work.

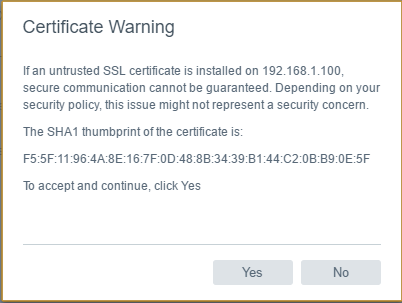
  • Accept the certificate

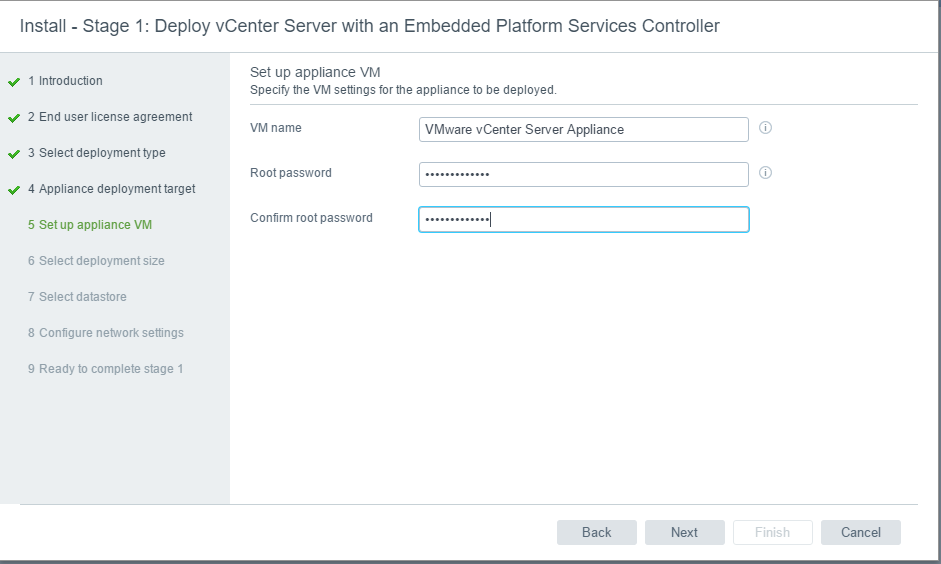
  • Put in a root password for the vCenter Server Appliance

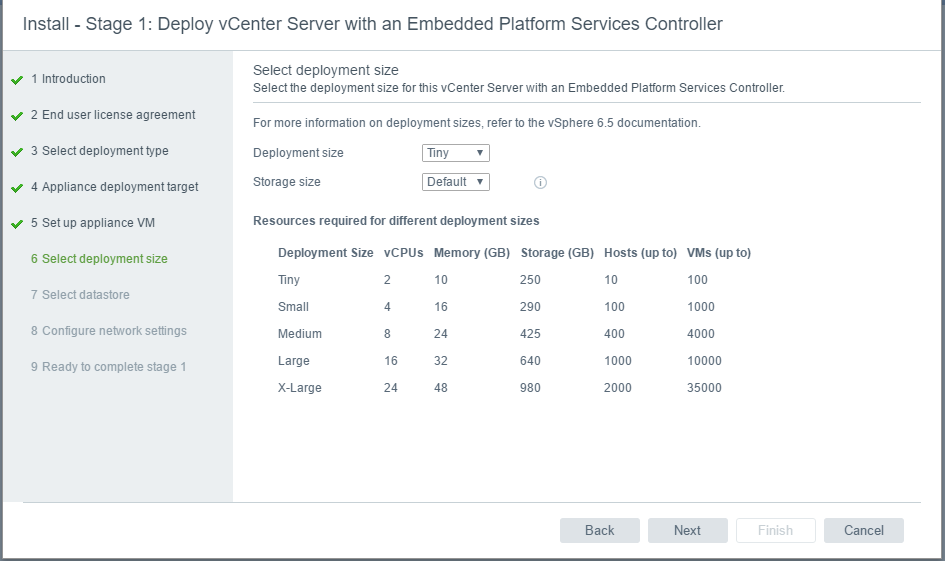
  • Select a deployment size

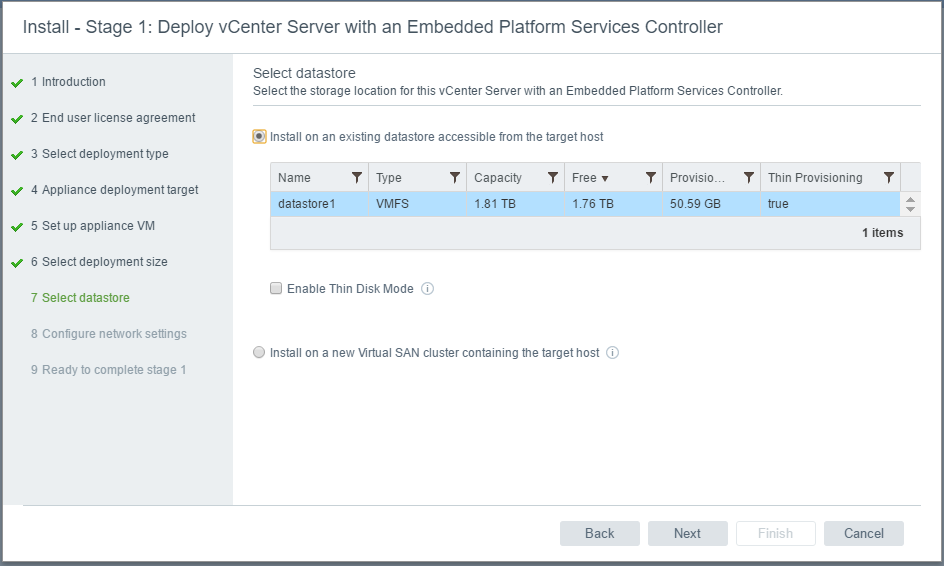
  • There are now 2 deployment types. You can install as normal or you can “Install on a new Virtual SAN cluster containing the target host”

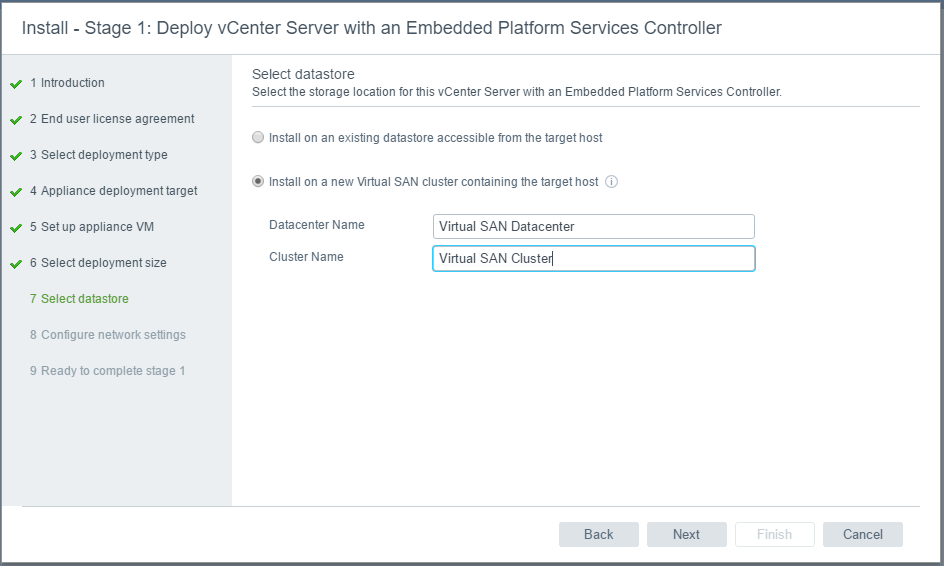
  • I am going to test this new feature of a combined install of vCenter and vSAN placing the vCenter on vSAN
  • Put in a name for your Datacenter and Cluster and click Next. It will say Loading

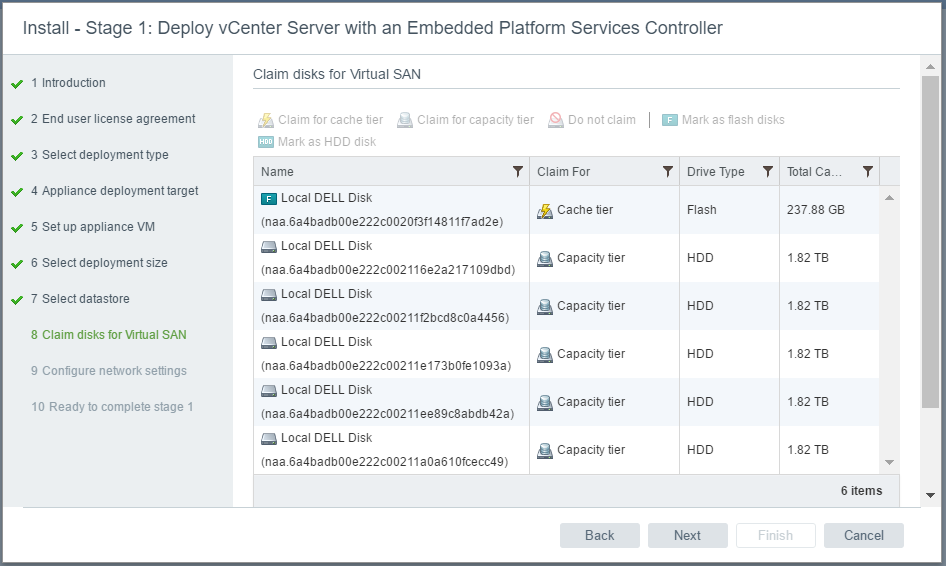
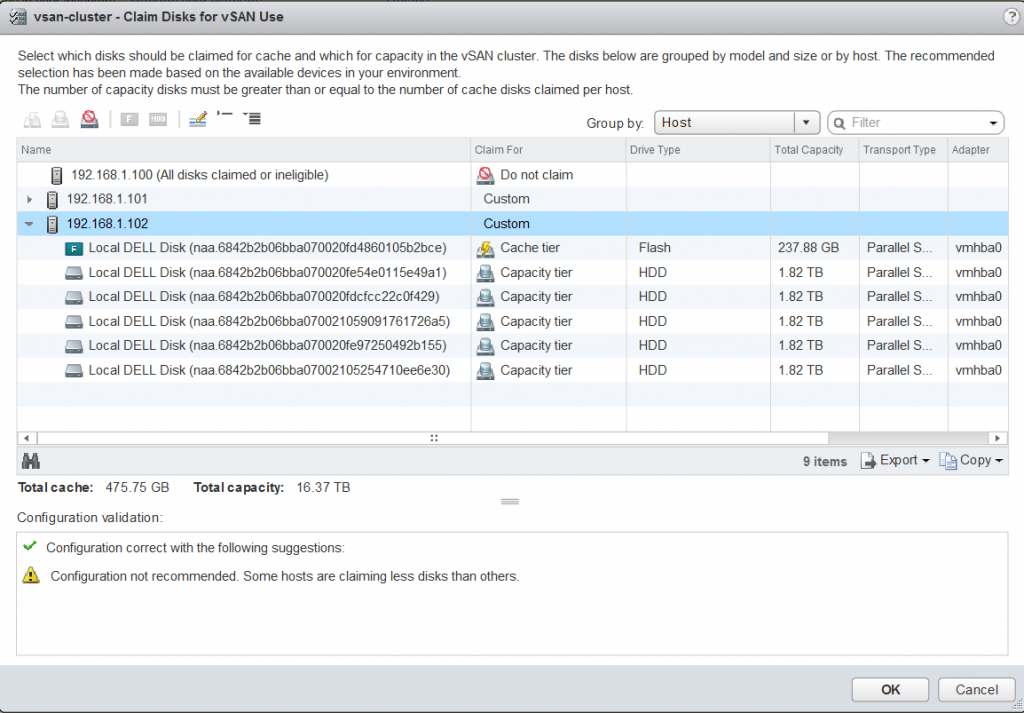
  • Claim disks for Virtual SAN. You can see it has picked up all my disks on my first host and recognizes the SSD and sets it as a cache Disk while the other non SSD Disks are set as Capacity Disks

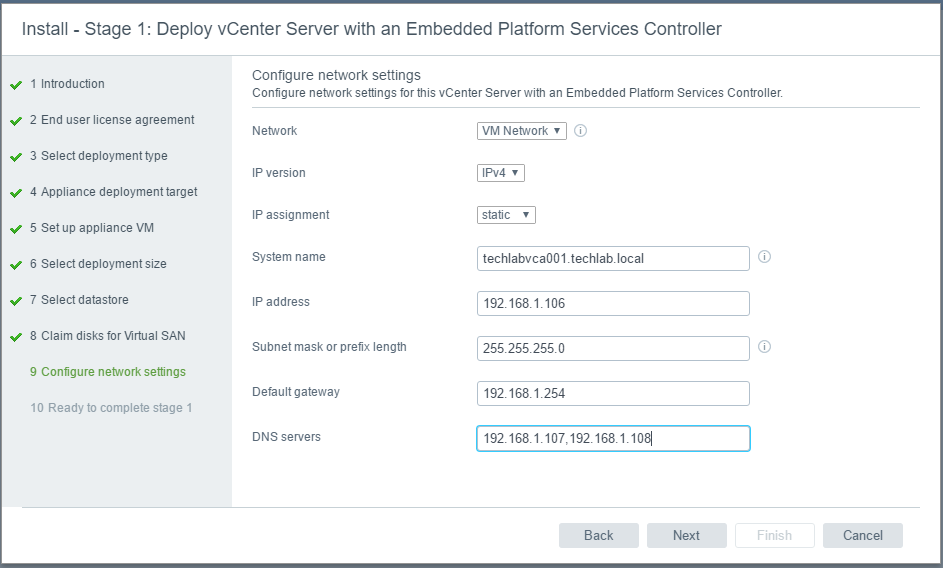
  • Next enter your network settings

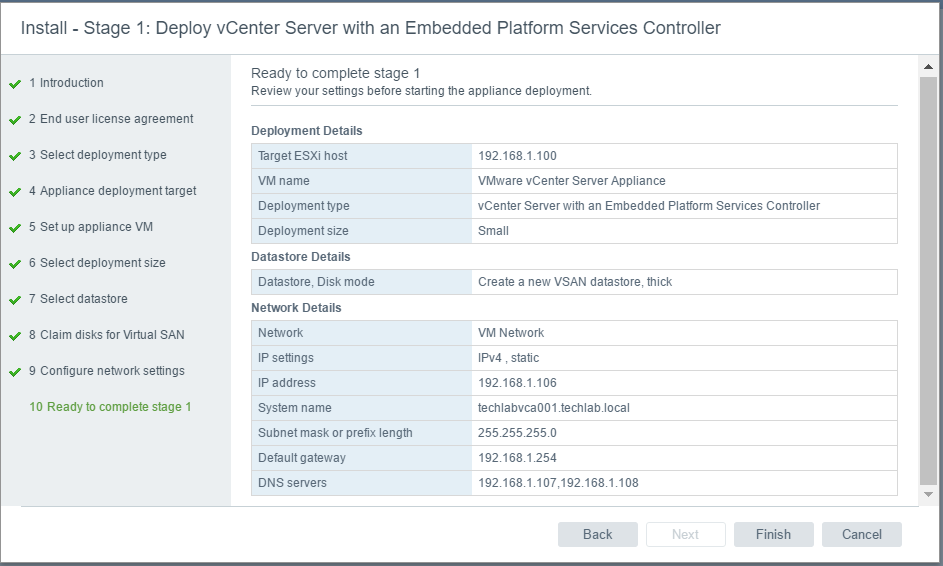
  • You are now ready to complete at Stage 1. Check the settings and click Finish

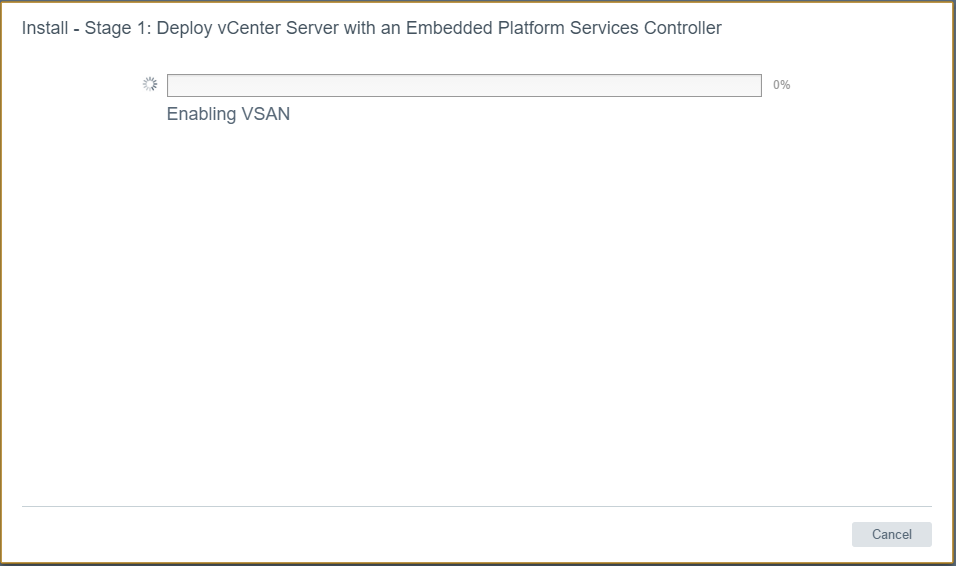
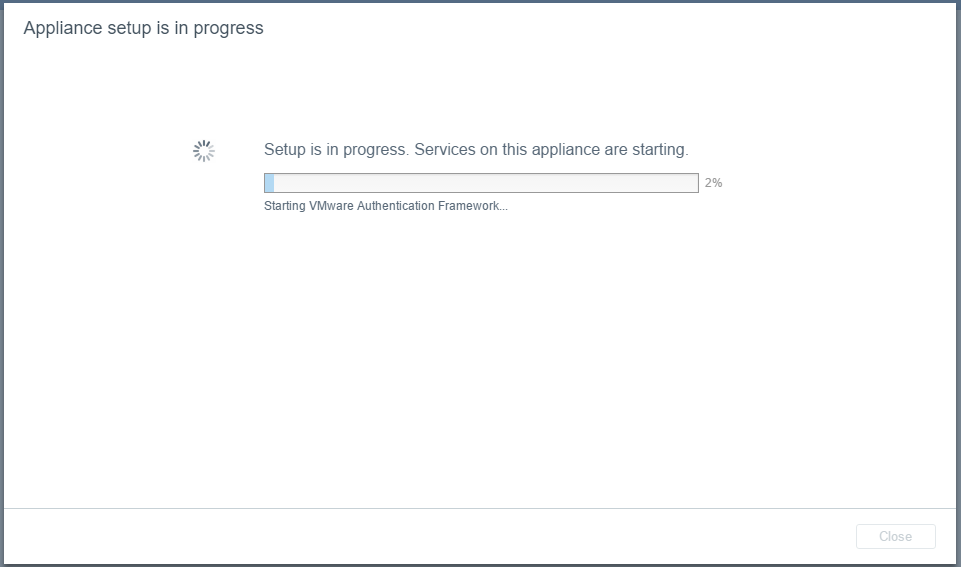
  • It will now show the following screen

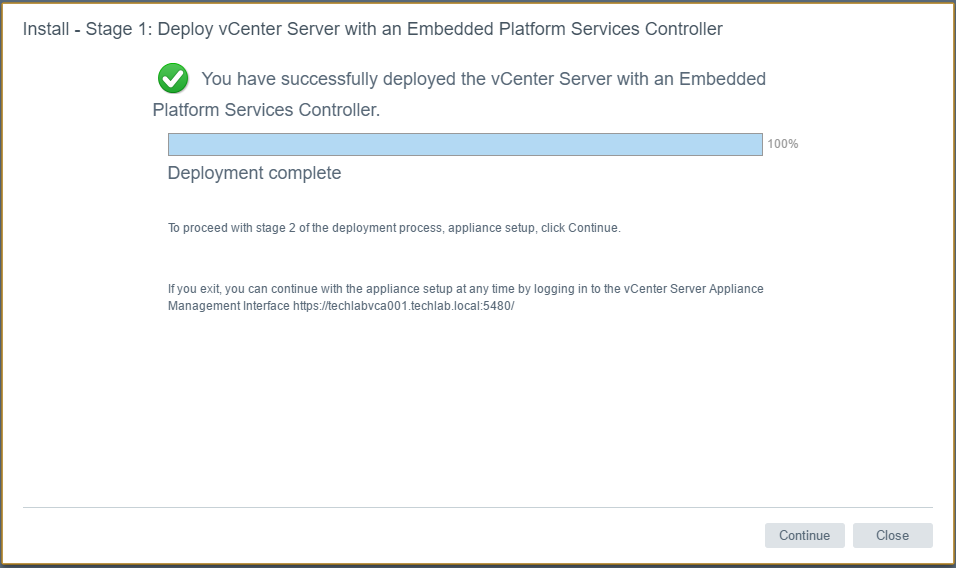
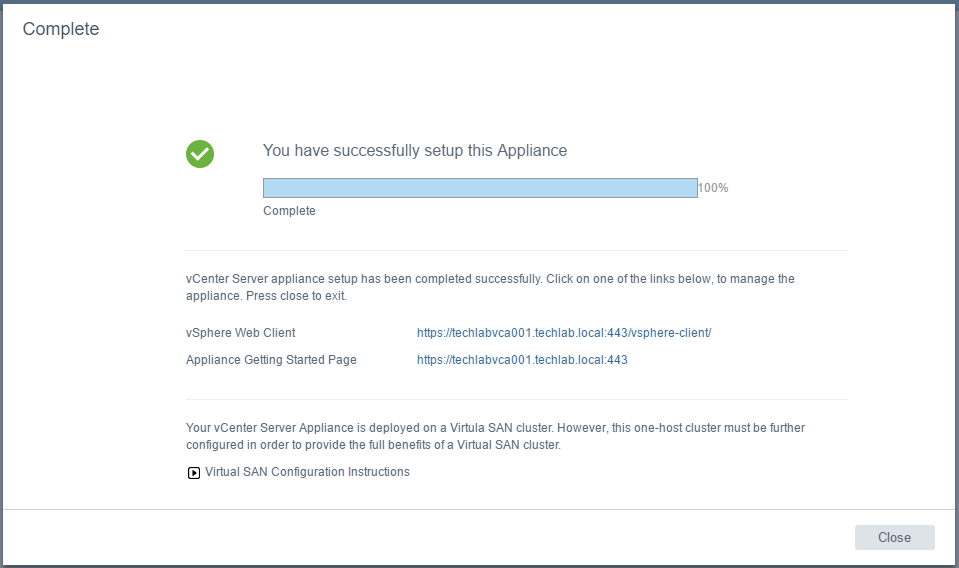
  • When it has finished you should see the below screen

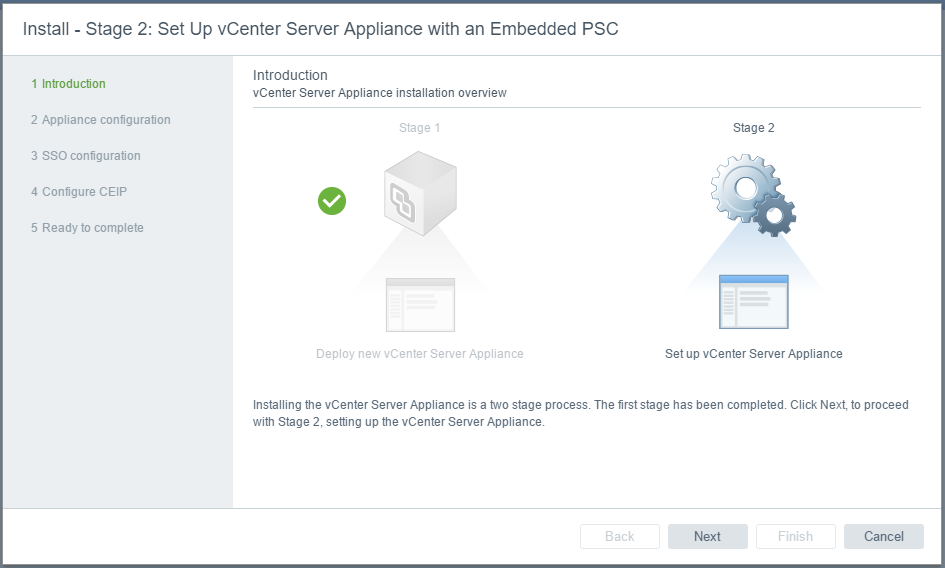
  • Click Continue and we will be on to Stage 2

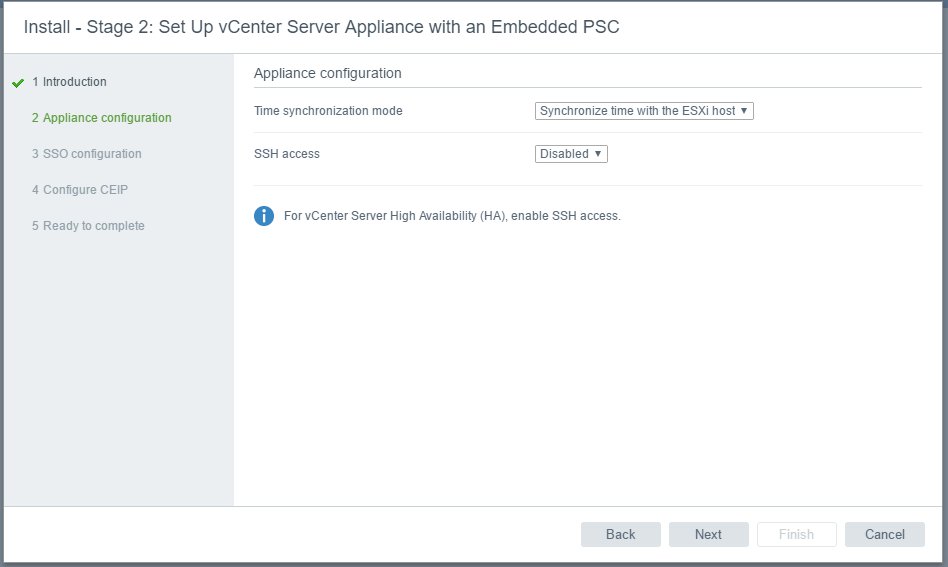
  • Next Enter the time settings. You can use NTP Servers or sync with the local host. You can also enable SSH

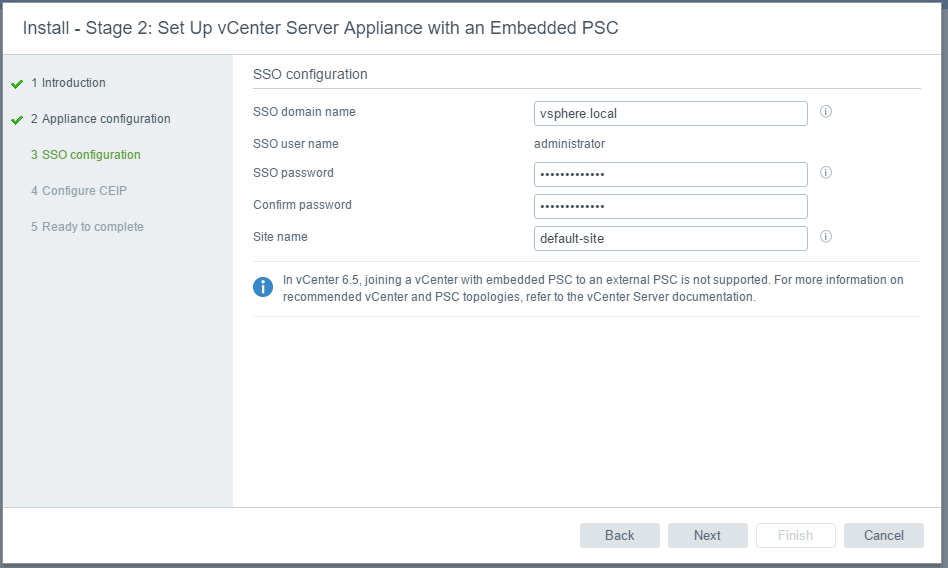
  • Next set up the embedded PSC

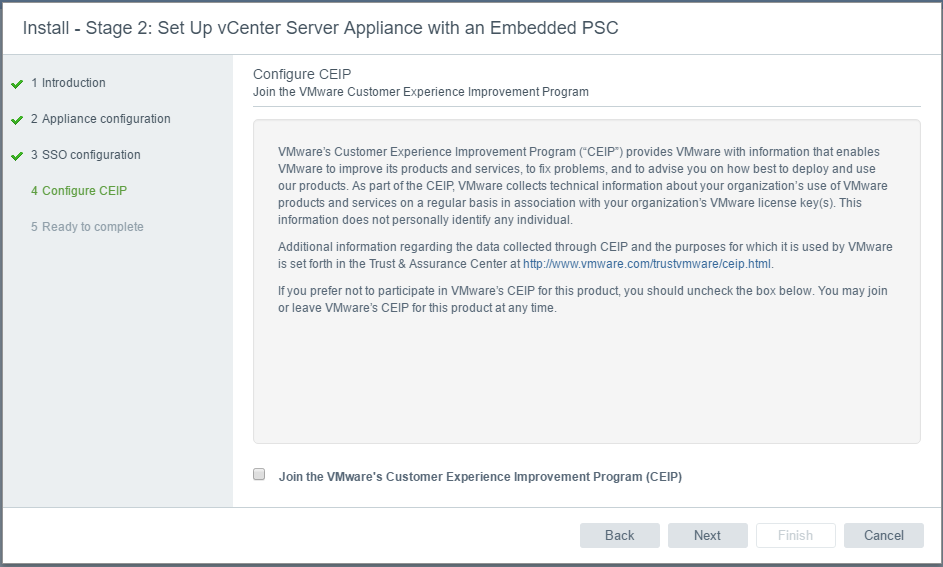
  • Next decide if you want to join the Customer Experience Program

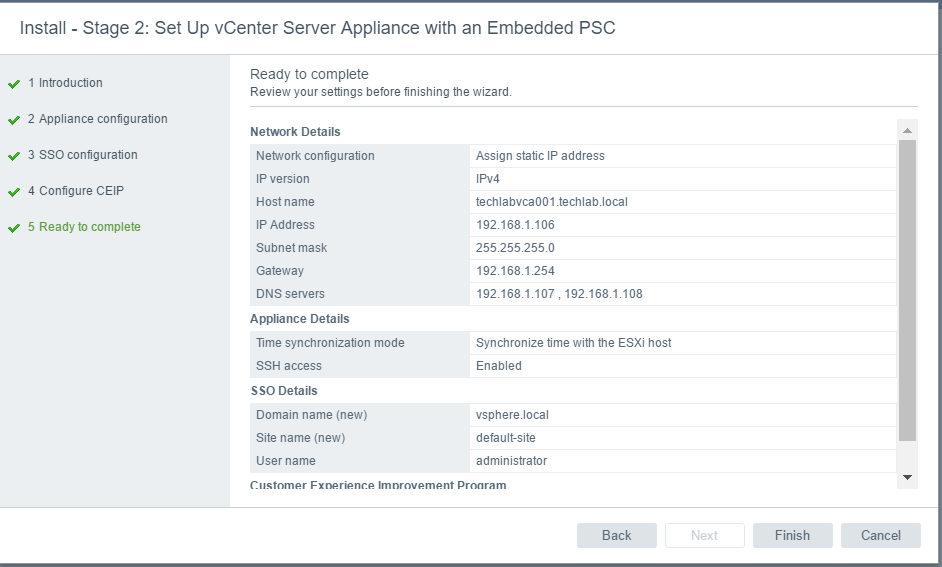
  • Finish and check the config

  • You should now see the below screen

  • When it has finished you will see the below screen

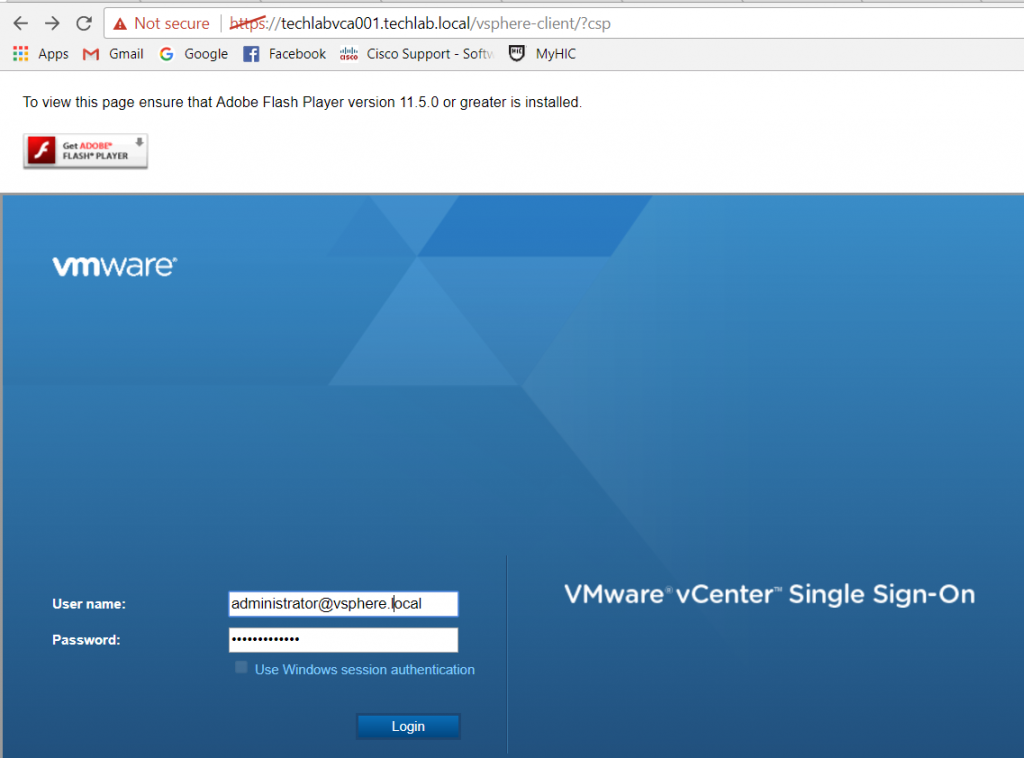
  • Next connect to the vCenter appliance with the administrator@vsphere.local account and the password you set up previously

https://techlabvca001.techlab.local/vsphere-client/

  • Select the Host > Select Configure > Select Networking > VMkernel Adapters

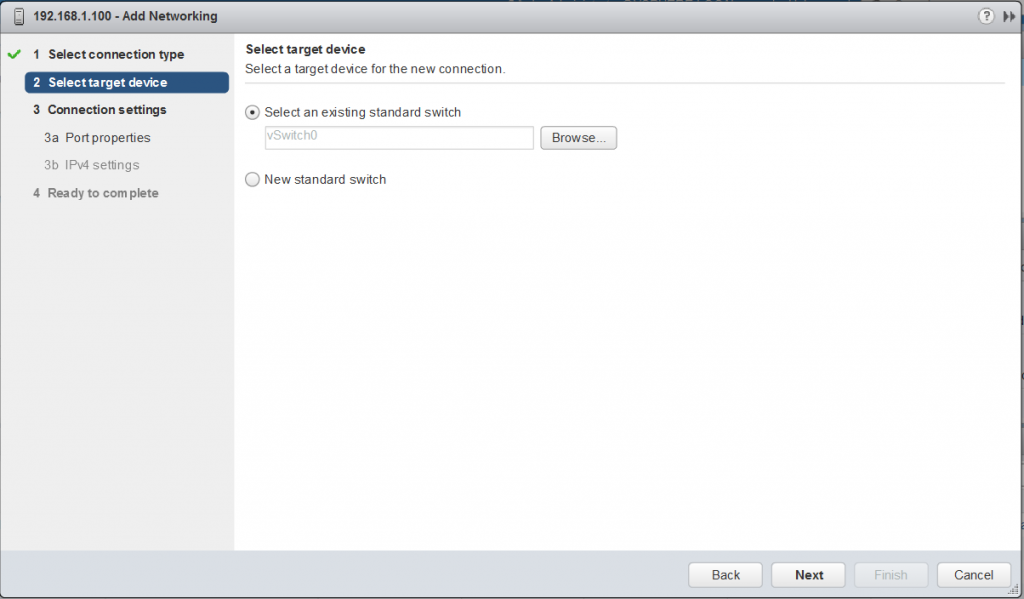
  • Select a switch

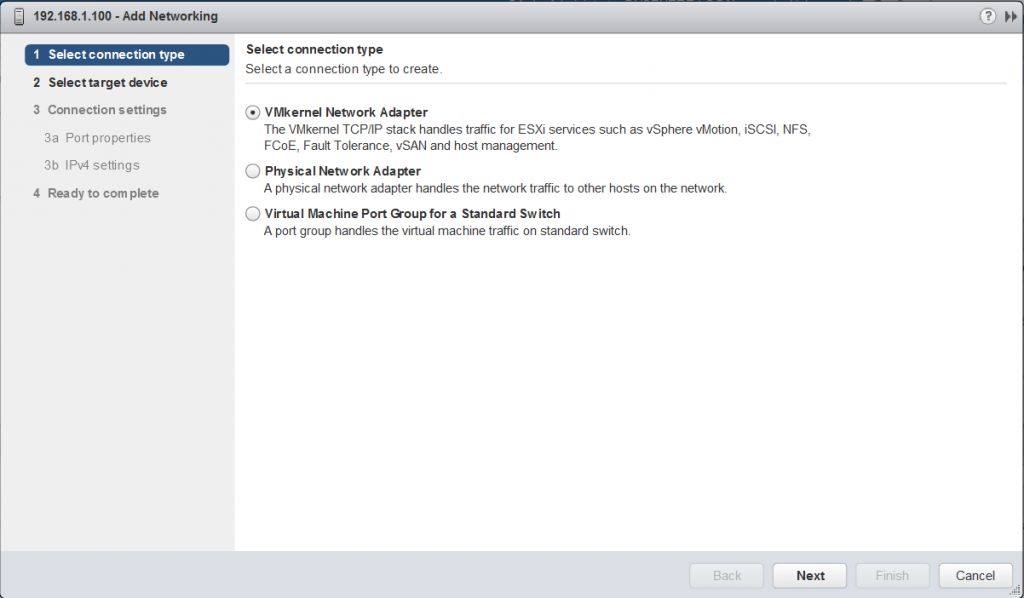
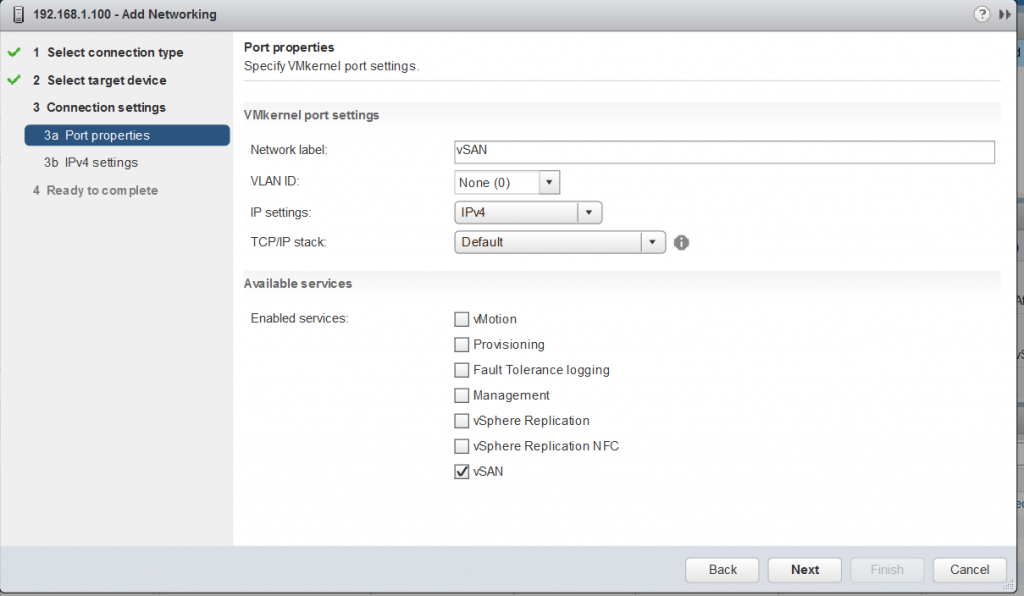
  • Add a VMkernel adapter for vSAN

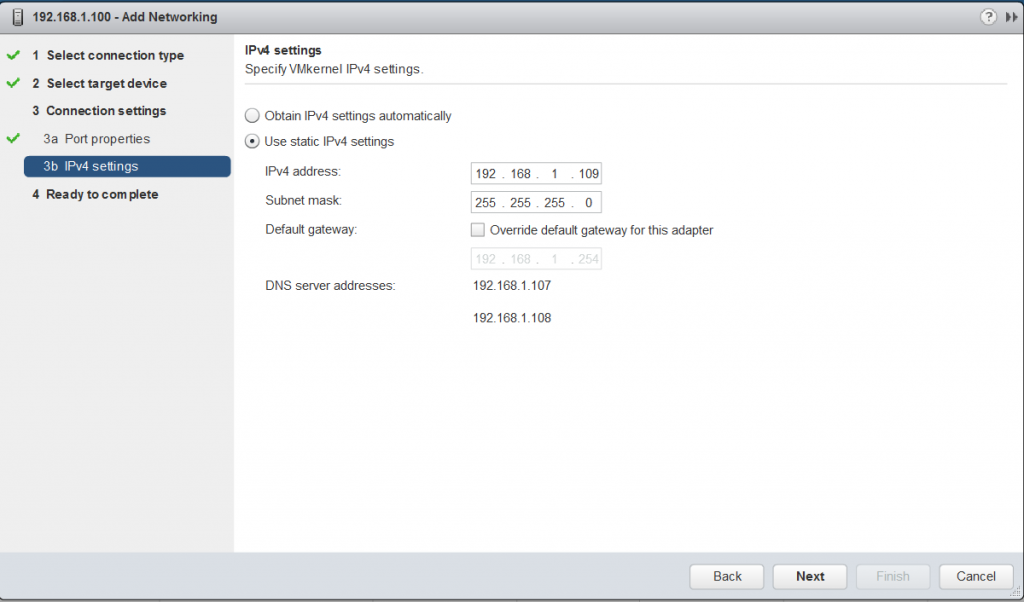
  • Specify VMkernel networking drivers

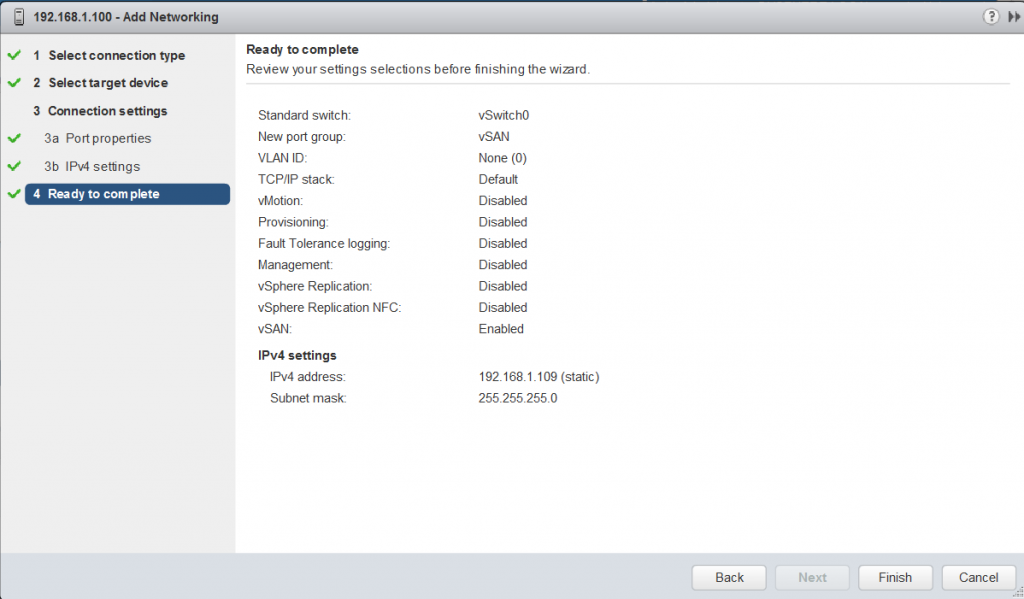
  • Check Settings and Finish

  • Next I need to add my other 2 hosts to the Datacenter and create a vSAN VMkernel port on each host followed by adding them into the cluster

  • Click on the cluster > Select Configure > vSAN > Disk Management and select your disks on the other servers and make them either the cache disk or capacity disk

  • This process is normally quite quick and once complete you should have your vSAN up and running!

  • Click on the cluster > Select Configure > Services and Edit Settings to turn on HA and DRS

  • Once everything is looking ok click on the cluster > vSAN > General > Configuration Assist to check any errors or warnings about any issues so you can fix these.

Procedure to shutdown the vSAN cluster and start it up again.

So it crossed my mind that as this is my lab, it is not going to be running 24×7 or my house is going to be rather warm and my electricity bill will definitely rise! I need to power it off therefore what is the correct way to shut everything down and power up again?

Normally to shutdown an ESXi Cluster, using vCenter Webclient, ESXi hosts have to be put into maintenance mode and then ESXi hosts are powered off. Also to start ESXi Cluster, vCenter Server is used to remove them from maintenance mode after powering on the hosts. However if the VSAN cluster is running management components such as vCenter Server and other management VMs, the ESXi host that is running vCenter Server cannot be put into maintenance mode. So vSAN Cluster shutdown and starting procedures have to be properly sequenced.

VMware KB

https://kb.vmware.com/selfservice/microsites/search.do?language=en_US&cmd=displayKC&externalId=2142676

Steps for Power Off

  • Start by powering off all virtual machines on ESXi cluster except the vCenter Server. If your Management cluster has ActiveDirectory which provides services to vCenter Server, then do not power off Active Directory VM as well
  • Migrate the vCenter Server VM and ActiveDirectory VM(s) to a single ESXi Host
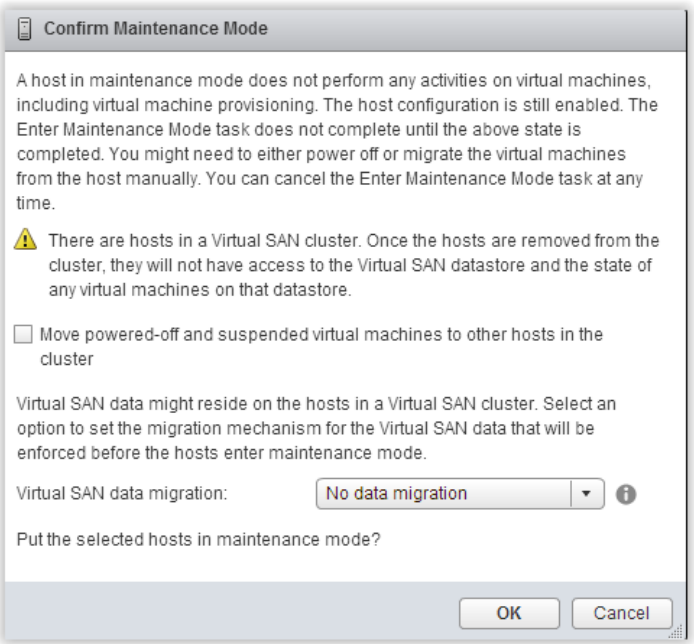
  • Place all the remaining hosts in the cluster into maintenance mode. When confirming the maintenance mode for ESXi Host, ensure the following selection is made ( deselect checkbox for Move powered-off VMs and “No data migration” is chosen for Virtual SAN data migration)
  • You can put the hosts in Maintenance Mode manually as per the baove step or you can use a command line command. You can run the ESXCLI command below to put a host in Maintenance mode. However, you must perform this operation through one of the CLI methods that supports setting the VSAN mode when entering Maintenance Mode. You can either do this by logging directly into the ESXi Shell and running ESXCLI.

esxcli system maintenanceMode set -e true -m noAction

other options are

esxcli system maintenanceMode set -e true -m ensureObjectAccessibility

esxcli system maintenanceMode set -e true -m evacuateAllData

  • Power off the vCenter Server VM and Active Directory VM. At this point, the vSphere WebClient access is lost.
  • Shutdown all ESXi Hosts. This will complete the Shutdown procedure for VSAN Cluster.

Starting the ESXi Hosts and the vSAN back up

The procedure to start a vSAN Cluster begins with the ESXi host where vCenter Server and Active Directory VMs are running.

  • Power on all ESXi hosts in the cluster.
  • Take the hosts out of maintenance mode
  • Identify ESXi host where vCenter Server and Active Directory VMs are located
  • Power on AD servers
  • Power on vCenter server
  • Note: If the vCenter Server VM has a vmnic that is tied to a VDS  network, then vCenter Server can’t be powered on because VM power-on operation on VDS requires vCenter Server to be running. So it is recommended to move any vmnic on vCenter Server to a vSwitch-based network. This can be moved back to the VDS Network afterwards
  • Log into vCenter and check vSAN

Useful Troubleshooting Tools

  • rvc console on vCenter
  • Putty
  • esxcli commands

I had an issue at a customer site where they had put some hosts in Maintenance Mode and when they brought them out again, the hosts came out of Maintenance Mode but the vSAN didn’t resulting in the misreporting of storage in your cluster. As a result storage policies will error and you won’t be able to put any more hosts in maintenance mode if there isn’t the visible storage to move them. Note: you won’t have lost any storage. The system will just think it’s not there until you put the host into Maintenance Mode and take it out again for a second time! VMware are aware of this issue which seems to be present in 6.5U1 however this was a customers automated system. I haven’t seen this happen in my home lab!

By running the command vsan.cluster_info 0 in rvc, you are able to see for every disk whether the node is evacuated or not. If you have taken the host out of Maintenance Mode and the vSAN has also come out of Maintenance Mode then it will say Node evacuated: no. If it hasn’t come out properly it will say Node evacuated: yes (won’t accept any new components)


Rolling back and recovering from failed vSphere 6 and external multisite PSC upgrades

Recovering from failed vSphere 6 and external multisite PSC upgrades 

So what happens if you have the following situation within a failed vSphere upgrade with a multi-site system?

The Scenario

The requirement was to upgrade 3 vCenters from 5.1U3 to 6.0U2. The vCenter servers previously had embedded SSO but have been repointed to the external 6.0 U2 PSCs. Note, we had an intermediary stage of repointing to 5.5U3 external SSOs first before we could upgrade the PSCs to 6.0U2. So once the PSCs are in a multisite 6.0U2 configuration, the upgrade of the vCenters can start and this is where we need to take care as the systems are interlinked at this point.

So we now have

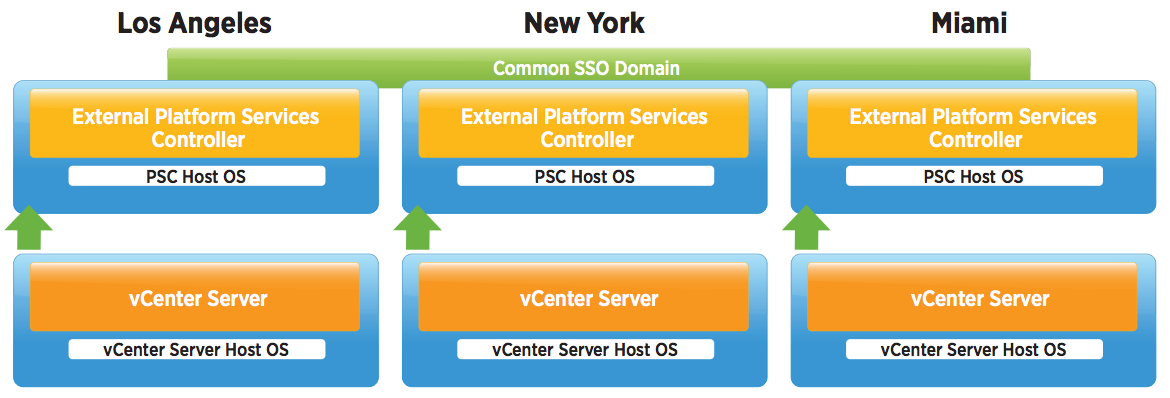
  • 3 x vSphere 6.0U2 PSCs set up in a multisite configuration
  • 3 x 5.1 U3 vCenters pointing to a vSphere 6.0U2 PSC
  • 3 x SQL 2008 R2 Databases running the vCenter Databases and the Update Manager Databases. Not seen in the example above

Why did it fail initially?

Never assume anything. We had already upgraded 2 environments without any issue so we overlooked checking the SQL environments which were meant to be a replica but clearly weren’t!

  • DB password had special characters in the password.
  • Needed to give db owner rights on the vCenter DB and the MSDB database prior to upgrading
  • The ODBC Connection was not the right version. We needed SQL Native Client 10 or 11.
  • Additional Database Permissions for VMware (Can be seen in the vSphere 6.0 Documentation Center
  • SQL Server 2008 R2 needed Service Pack 2 installing. (No problem with this)
  • An informational messages regarding the vCenter FQDN
  • An informational message about the ALL_SERVICES accounts. (New in vSphere. Depends if you want to use Local System for all your vCenter Services or use the multiple vSphere accounts for individual services

So how do you recover from one failed vCenter Upgrade in this scenario?

We do need to take into account at what step has it failed and check the logs to verify this. Can it be an issue that can be worked though and fixed forward or do you need to rollback and depending on how far the installer has got before failing, it might open variations in the options for a rollback.  For example, if it fails to authenticate to the database, then it is unlikely it would have made any DB changes. The installer logs will give us this information.

You can retrieve the installation log files manually for examination.

Procedure

1

Navigate to the installation log file locations.

%PROGRAMDATA%\VMware\vCenterServer\logs directory, usually C:\ProgramData\VMware\vCenterServer\logs

%TEMP% directory, usually C:\Users\ username\AppData\Local\Temp

The files in the %TEMP% directory include vminst.log, pkgmgr.log, pkgmgr-comp-msi.log, and vim-vcs-msi.log.

2

Open the installation log files in a text editor for examination.

Steps

  • Make sure you have been through all the pre-requisites prior to starting the upgrade and test in a lab as well. Give yourself the best start at not failing.
  • Snapshot the whole environment (All VCs, All DBs and all All PSCs) Make sure the environment is quiesced or if you want a more consistent image vs crash consistent, shutdown the whole environment and snapshot it cold
If the upgrade of any VC 5.x to 6.0 fails in this environment, you must roll back ALL PSC.  The reason is that the solution user format differs between 5.x and 6.x. During the upgrade of the VC, the VC 5.x solution users will be removed from the PSC and replaced with 6.x solution users early in the VC 6.x upgrade (during vmafd firstboot I believe). If you have a failure and only roll back the VC then you have a VC with 5.x solution users talking to a PSC that no longer is aware of those users. You must roll back ALL PSCs in the SSO Domain as they replicate.
  • If you encounter an unrecoverable upgrade installer error then in the event of rolling back to snapshots, the order will be all PSCs, the vCenter DB and vCenter Server
  • In the event the rollback above fails, all servers should be rolled back again with the order of power on being all PSCs, all vCenter DBs and all vCenter servers

Questions we have been asked

During an upgrade, could we stop/break the multisite replication agreements between PSCs to avoid any replication of issues in the event of an upgrade problem on one vCenter? 

There’s no issue with breaking replication agreements generally but it not something that should be done for an upgrade. The vdcrepadmin command line tool does allows the breaking and creating of agreements and it actually protects the customer by not allowing them to delete the only agreement available. This prevents a customer from inadvertently creating an isolated PSC. What you would do is go through and create the new agreements and once they are in place just delete the extra ones. There is nothing special about the replication agreements that are created during PSC deployment. They are the same as ones created with vdcrepadmin.


PSC 6 Replication for multi-site setups

PSC 6 Replication 

VMware Validated Designs

First of all I’d like to talk about VMware Validated Designs before going on to talk about how these can be incorporated into replicated PSC designs.

VMware Validated Designs deliver holistic data center-level designs that span compute, storage, networking and management, defining the gold standard for how to deploy and configure the complete VMware SDDC stack in a wide range of use cases. VMware Validated Designs include detailed guidance that combine with best practices on how to operate a VMware SDDC optimally. The benefits are

  • Accelerate time to market
  • Increase efficiency
  • De risk deployments and operations
  • Drive agility
  • Repeatable proven solutions

When looking to implement any software from the SDDC suite, we are now referring to the VMware Validated Designs for a repeatable proven solution. Of course there may always be modifications required to fit customers environments but the idea going forwards is to maintain the same standards of installation and configuration

Platform Services Controller Topology Decision Tree

Adam Eckerle from VMware has very kindly designed a poster containing a decision tree for anyone thinking of deploying PSCs and guides you through a set of decisions before deployment

https://kb.vmware.com/selfservice/microsites/search.do?language=en_US&cmd=displayKC&externalId=2113115

PSC and Replication Points

  • All PSC replication is bi-directional but ring topology setups have to be manually created
  • Ring topology is now the recommended method, not mesh as it was previously
  • By default each PSC is replicating with only a single other PSC (the one you select when installing the additional secondary or tertiary PSC)
  • Site names do not have anything to do with replication today they are a logical construct for load balancers and future usage
  • Changes are not unique to a site but to a domain assuming they are part of the vsphere.local domain
  • vCenter only points to one PSC at a time or a load balanced address
  • PSC’s have to be part of the same domain together to use enhanced linked mode

Why Ring Topologies and not Mesh Topologies?

  • Ring Topologies allow for easier scaling out
  • They are easier to set up and maintain. There’s no issue with breaking and recreating replication agreements. vdcrepadmin does this and it actually protects the customer by not allowing them to delete the only agreement available. This prevents a customer from inadvertently creating an isolated PSC. What you would do is go through and create the new agreements and once they are in place just delete the extra ones. There is nothing special about the replication agreements that are created during PSC deployment. They are the same as ones created with vdcrepadmin
  • The failure of any one component in a ring does not cause replication partitions
  • Minimal links can be created for maximum redundancy which is increased when load balancers are used.

2 Site VVD Design

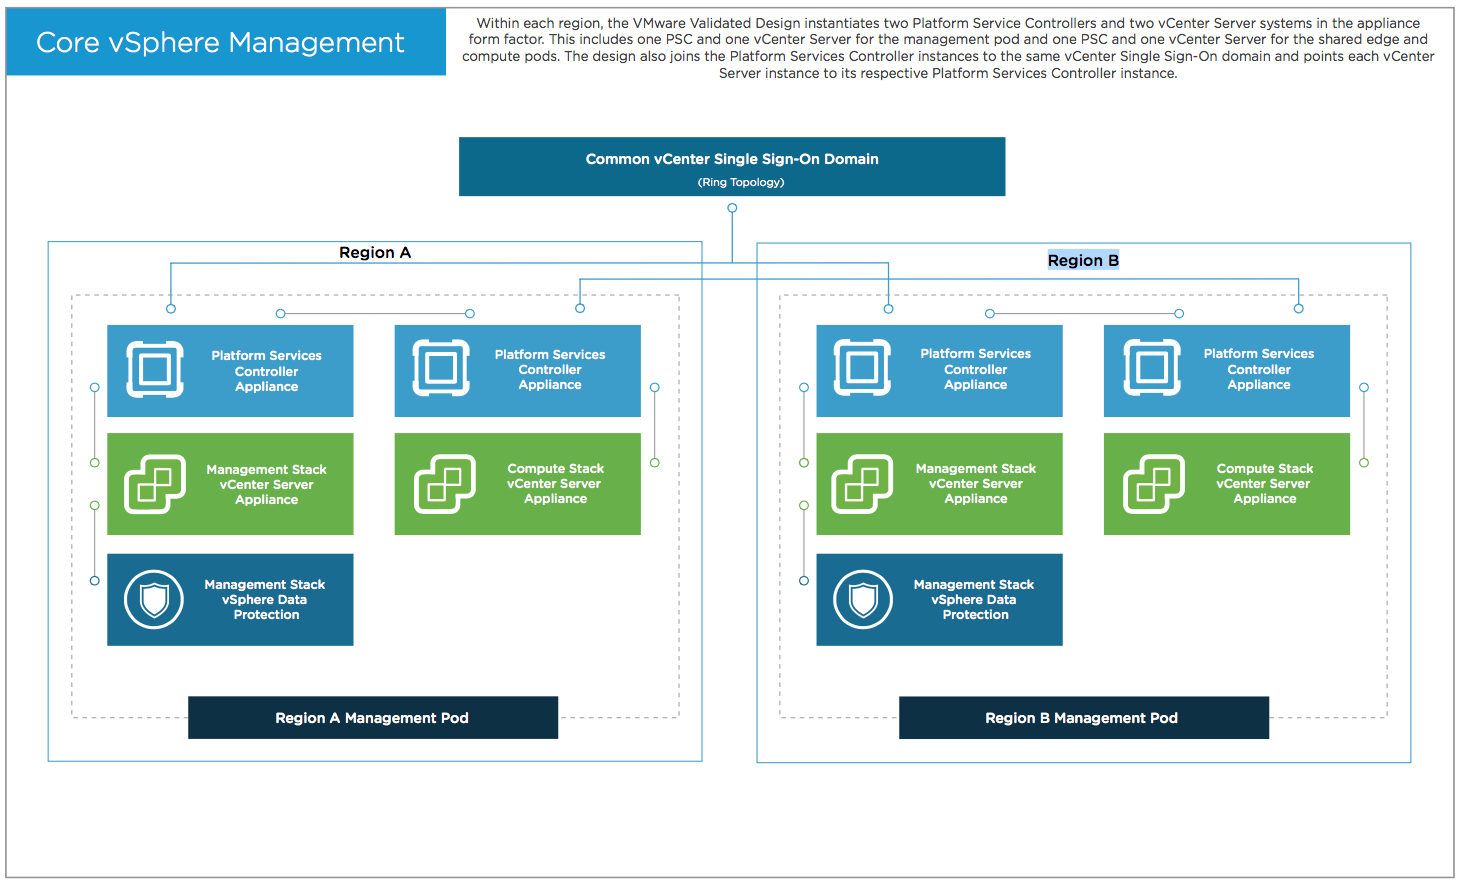
In the diagram below, you can see within each region/site, the VMware Validated Design instantiates two Platform Services Controllers and two vCenter Server systems in the appliance form factor. This includes one PSC and one vCenter for the management pod and one PSC and one vCenter for the shared edge and compute pod. The design also joins the Platform Services Controller instance to its respective Platform Services Controller instance.

3 Site VVD Design

When we start getting into a 3 site multisite design, we can then see how keeping it simple makes life a great deal easier. Below is a series of diagrams which show how this can be set up with a recommended ring topology.

This particular example uses 3 sites with 2 PSCs in each. There is no load balancer.

Steps

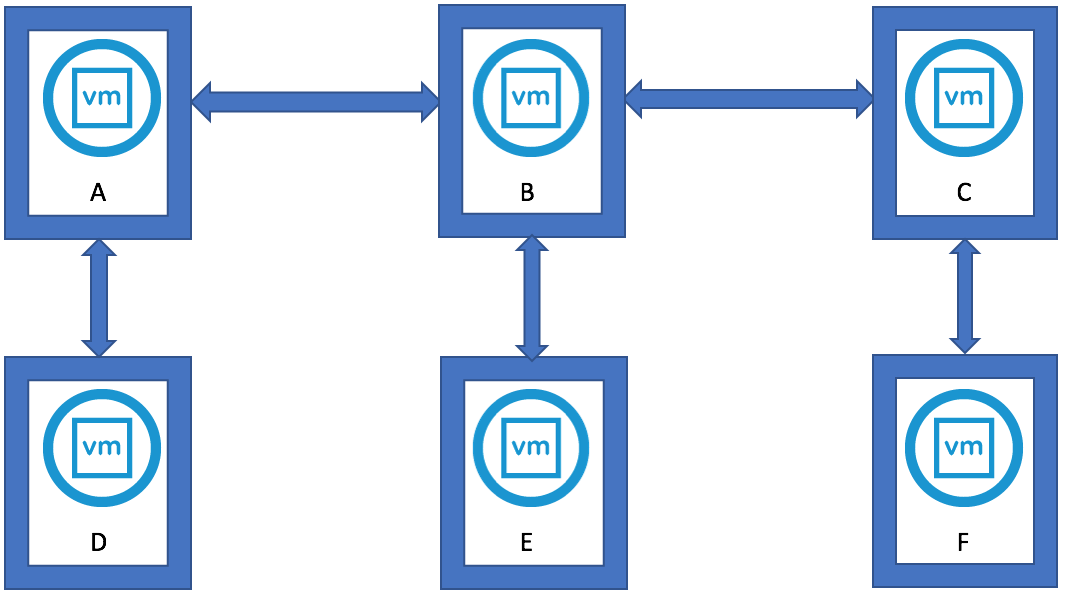
  • When initially installing the external PSCs, PSCA will be the first standalone PSC. PSCB will be installed next and partnered with PSCA. PSCC is then installed and partnered with PSCB. This is 2 way automatic replication in an inline configuration

  • If we wanted to make it a ring topology with just these 3 servers we could do the following and create a replication agreement between PSCA and PSCC

  • Now we add the second PSCs into each site and we get the following scenario. 2 way automatic links are created between the first and second PSC in each site (A and D) (B and E) and (C and F)

  • Now we see we have kind of lost our inline topology and how do we create a ring now? We want an inline topology of D > A > B > E > C > F
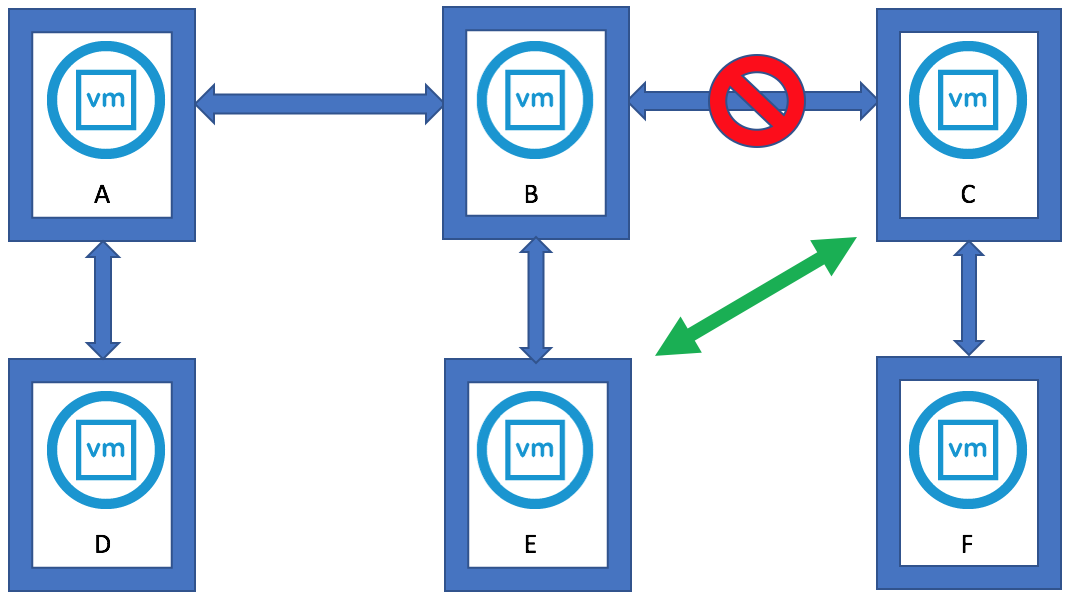
  • We actually need to create a new agreement between PSCE and PSCC followed by breaking the link between PSCB and PSCC. Remember the system will not let us break a replication agreement which would leave a PSC isolated so we need to create a link first

  • We will now get the following inline configuration

  • Next we want to create our ring topology. A replication agreement is created between PSCD and PSCF to create the ring


Stratoscale explains IaaS, PaaS and SaaS – “The Good”, the “Bad” or the “Ugly”?

Stratoscale asked 32 IT experts to share their insights on the differences between IaaS, PaaS and SaaS in the great article below.

Please enjoy the insights on “The Good”, the “Bad” or the “Ugly”? within IaaS, PaaS and SaaS.

http://www.stratoscale.com/resources/article/iaas-paas-saas-the-good-bad-ugly/

Cloud computing is a broad term for the various IT-related services that can be provided on demand using a consumption based model.

The three most common cloud computing models:

  • Infrastructure as a Service (IaaS)
  • Platform as a Service (PaaS)
  • Software as a Service (SaaS)

There are countless articles covering cloud services. Yet, you might still be confused about what the heck all these “as a service” terminologies are. You are not alone, we hope that after you read what 30+ cloud experts have to say about their value, advantages, benefits and best practices things will be much clearer.