Why suspend a VM?

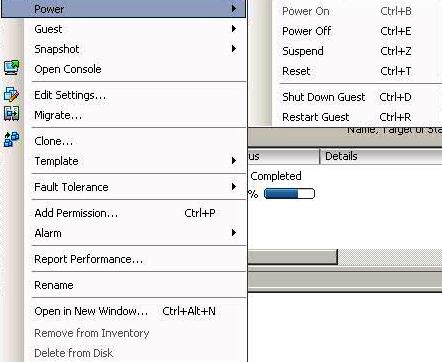
Suspending a virtual machine is similar to putting a real computer into the sleep mode. When you suspend a virtual machine, you save its current state (including the state of all applications and processes running in the virtual machine) to a special file on your. When the suspended virtual machine is resumed, it continues operating at the same point the virtual machine was at the time of its suspending.

Suspending your virtual machine may prove efficient if you need to restart your host, but do not want to:

  1. Quit the applications running in the virtual machine
  2. Spend much time on shutting the guest operating system down and then starting it again

What is Pluggable Storage Architecture (PSA) and Native Multipathing (NMP)?

Pluggable Storage Architecture

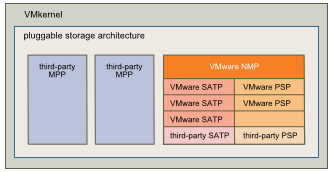
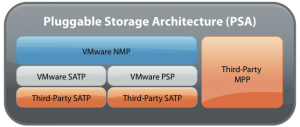
To manage storage multipathing, ESX/ESXi uses a special VMkernel layer which sits in the SCSI middle layer of the VMKernel I/O Stack, Pluggable Storage Architecture (PSA). The PSA is an open modular framework that coordinates the simultaneous operation of multiple multipathing plugins (MPPs). PSA is a collection of VMkernel APIs that allow third party hardware vendors to insert code directly into the ESX storage I/O path. This allows 3rd party software developers to design their own load balancing techniques and failover mechanisms for particular storage array. The PSA coordinates the operation of the NMP and any additional 3rd party MPP

What does PSA do?

  • Load and unload multipathing plug-ins
  • Uses predefined claim rules to assign each device to an MPP (One claim rule per device)
  • Handle physical path discovery and removal (through scanning)
  • Route I/O requests for a specific logical device to an appropriate multipathing plug-in
  • Handle I/O queuing to the physical storage HBAs and to the logical devices
  • Implement logical device bandwidth sharing between virtual machines
  • Provide logical device and physical path I/O statistics

Native Multipathing Plugin

The VMkernel multipathing plugin that ESX/ESXi provides, by default, is the VMware Native Multipathing Plugin (NMP). The NMP is an extensible module that manages subplugins. There are two types of NMP subplugins: Storage Array Type Plugins (SATPs), and Path Selection Plugins (PSPs). SATPs and PSPs can be built-in and provided by VMware, or can be provided by a third party.If more multipathing functionality is required, a third party can also provide an MPP to run in addition to, or as a replacement for, the default NMP.

VMware provides a generic Multipathing Plugin (MPP) called Native Multipathing Plugin (NMP) which supports all storage arrays on the Compatibility list

A single MPP can support multiple SATPs and PSPs. If a storage vendor has not supplied an MPP, SATP or PSP, VMware will use its own assigned by default

PSA

What does NMP do?

  1. Manages physical path claiming and unclaiming.
  2. Registers and de-registers logical devices
  3. Associates physical paths with logical devices.
  4. Processes I/O requests to logical devices
  5. Selects an optimal physical path for the request (load balance)
  6. Performs actions necessary to handle failures and request retries.
  7. Supports management tasks such as abort or reset of logical devices.

How it works

The ESX kernel (VMkernel) goes down through three layers when communicating with storage:

  1. In the top layer, VMware native NMP or third-party MPP software decides which SATP to use, or whether to use the native interface.
  2. The SATP layer includes native generic path selection (active/active, active/passive), standard ALUA, as well as allowing third-party plugins (SATP) to override its behavior. The SATP monitors these paths, reports changes, and initiates fail-over on the array as needed.
  3. At the PSP layer, software decides which physical channel to use for I/O requests.

In more detail

  • NMP assigns a SATP to every physical path to the logical device (datastore)
  • NMP associates paths to logical devices
  • NMP decides which PSP to use with the logical device.
  • The VM tells NMP an I/O is ready to send.
  • I/O is issued.
  • PSP is selected. Load-balances if applicable.
  • I/O is sent to  device.
  • Success:Device driver (Storage array) indicates I/O is complete. Failure: NMP calls appropriate SATP.
  • Success: NMP tells PSP I/O is complete. Failure: SATP interprets error codes and fails over to inactive paths.
  • Failure: PSP is called again to select which path to use for I/O excluding the failed path.
  • PSP checks every 300 seconds if the path is active again. SATP is responsible for doing the failover.

PSA Plugins

There are three types of PSA plugins for vSphere 4:

  1. Storage Array Type Plug-In (SATP)
  2. Path Selection Plug-in (PSP)
  3. A complete third-party multipathing software stack (MPP)

As is the case with VAAI, VMware includes a number of third-party plug-ins in the ESXi install. Users can simply activate many of these according to their needs, though some require additional fees and licensing.

SATP Plugins

SATPs allow load balancing across multiple paths, intelligent path selection, and over troubled conditions such as “chatter”, when passed rapidly fail back and forth between controllers.

The SATP has critical tasks to perform in the PSA stack:

  1. Decide which method of communication to use with the storage (PSA or native)
  2. Monitor the health of the physical I/O channels or paths
  3. Report any changes in the state of the paths up the stack
  4. Perform actions required to fail over storage between controllers on the array

VMware vSphere includes a variety of generic SATP plugins for storage arrays.

  • VMW_SATP_LOCAL – Local SATP for direct-attached devices
  • VMW_SATP_DEFAULT_AA – Generic for active/active arrays
  • VMW_SATP_DEFAULT_AP – Generic for active/passive arrays
  • VMW_SATP_ALUA – Asymmetric Logical Unit Access-compliant arrays
  • VMW_SATP_LSI – LSI/NetApp arrays from Dell, HDS, IBM, Oracle, SGI
  • VMW_SATP_SVC – IBM SVC-based systems (SVC, V7000, Actifio)
  • VVMW_SATP_SYMM – EMC Symmetrix DMX-3/DMX-4/VMAX, Invista
  • MW_SATP_CX – EMC/Dell CLARiiON  and Celerra (also VMW_SATP_ALUA_CX)
  • VMW_SATP_INV – EMC Invista and VPLEX
  • VMW_SATP_EQL – Dell EqualLogic systems

You can see which SATP plug-ins are available using the following esxcli command:

esxcli storage nmp satp list

PSP Plugins

In contrast to the diversity of VAAI and SATP plug-ins, the universe of path selection plug-ins is fairly small. Most storage arrays are supported with either Most Recently Used (MRU) or Fixed path selection approaches. Many also support Round Robin (RR) path selection. The only vendor with a specific PSP that is not also part of a full MPP (like EMC PowerPath or HDS HDLM) is Dell, which offers a special routed path selection plug-in for the EqualLogic iSCSI arrays.

  • VMW_PSP_MRU – Most-Recently Used (MRU) – Supports hundreds of storage arrays
  • VMW_PSP_FIXED – Fixed – Supports hundreds of storage arrays
  • VMW_PSP_RR – Round-Robin – Supports dozens of storage arrays
  • DELL_PSP_EQL_ROUTED – Dell EqualLogic iSCSI arrays

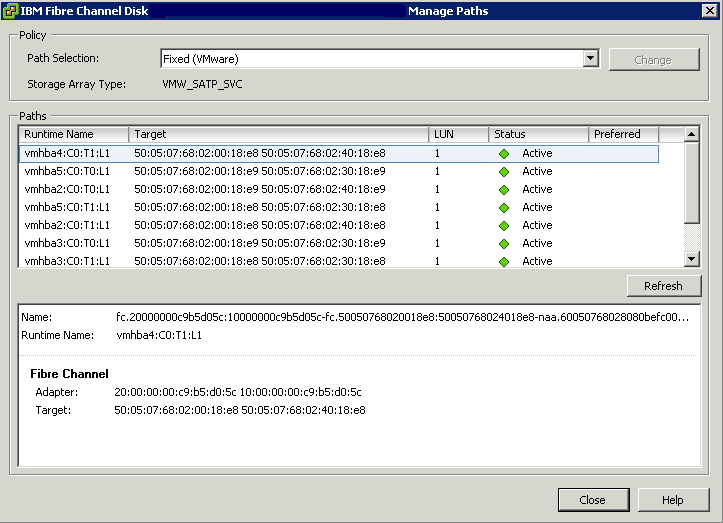
You can view the Path Polices in vCenter

  • Click on the Host
  • Click Configuration
  • Click Storage
  • Click on a Datastore and click Properties
  • Click Manage paths and you should see the below

paths

Array Types

  • Active /Active arrays use Fixed PSP Plugins
  • Active/Passive arrays use Most Recently Used PSP Plugins

ESXCLI Commands

  • esxcli storage nmp psp list

Capture1

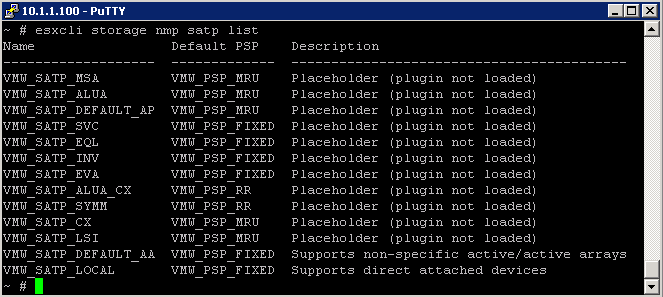
  • esxcli nmp satp list

Capture2

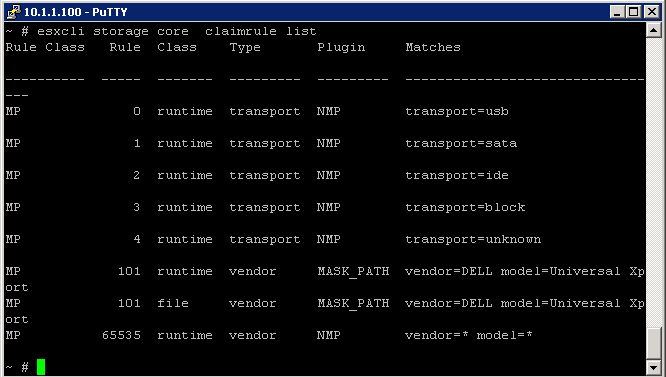
  • esxcli storage core claimrule list

Capture3

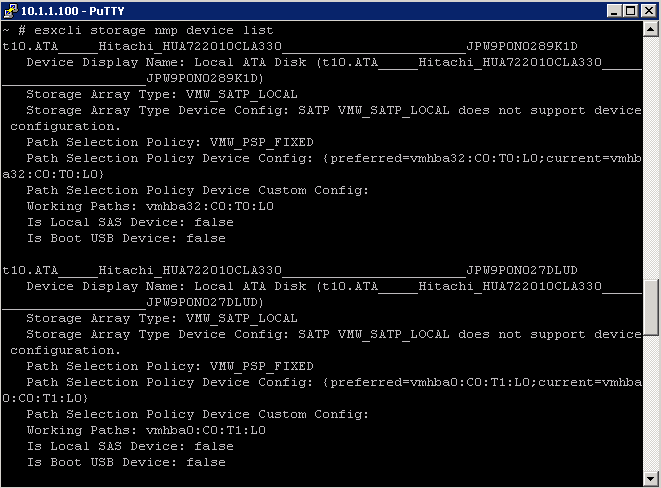
  • esxcli storage nmp device list

Capture4

VMware Netflow Monitoring

What is Netflow?

It’s a Cisco protocol that was developed for analysing network traffic. It has become an industry standard spec for collecting types of network data for monitoring and reporting. Data sources being switches and routers etc

  • A network Analysis Tool for monitoring the network and for gaining visibility into VM Traffic
  • A tool that can be used for profiling, intrusion detection, networking forensics and compliance
  • Supported on Distributed Virtual Switches in vSphere 5
  • Sarbanes Oxley compliance
  • Not really for packet sniffing,more for profiling the top 10 network flows etc

How is it implemented?

It is implemented in vSphere 5 dvSwitches

What types of flow does Netflow capture?

  • Internal Flow. Represents intrahost virtual machine traffic. Traffic between VM’s on the same host
  • External Flow. Represents interhost virtual machine traffic and physical machine to virtual machine traffic. Traffic between VM’s on different hosts or VM’s on different switches

What is a flow?

A flow is a sequence of packets that share the same 7 properties

  1. Source IP Address
  2. Destination IP Address
  3. Source Port
  4. Destination Port
  5. Input Interface ID
  6. Output interface ID
  7. Protocol

Flows

A flow is unidirectional. Flows are processed and stored as flow records by supported network devices such as dvSwitches. The flow records are then sent to a NetFlow Collector for additional analysis.

Although efficient, NetFlow can put an additional strain on your network or the dvSwitch as it requires extra processing and additional storage on the host for the flow records to be processed and exported.

Third Party NetFlow Collectors – What do they do?

Third Party vendors have NetFlow Collector Products which can include the following features

  • Accepts and stores network flow records
  • Includes a storage system for long term storage on flow based data
  • Mines, aggregates and reports on the collected data
  • Customised user interface (Web based usually)

Reporting

The Netflow Collector reports on various kinds of networking information including

  1. Top network or bandwidth flows
  2. The IP Addresses which are behaving irregularly
  3. The number of bytes a VM has sent and received in the past 24 hours
  4. Unexpected application traffic

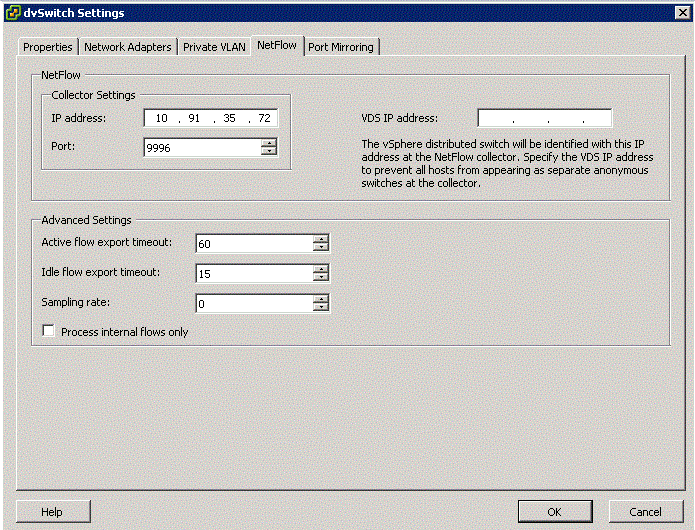
Configuring Netflow

  1. Go to Networking Inventory View
  2. Select dvSwitch and Edit Settings
  3. Click Netflow tab to see the box above

Description of options

  • Collector IP Address and Port

The IP Address and Port number used to communicate with the Netflow collector system. These fields must be set for Netflow Monitoring to be enabled for the dvSwitch or for any port or port group on the dvSwitch

  • VDS IP Address

An optional IP Address which is used to identify the source of the network flow to the NetFlow collector. The IP Address is not associated with a network port and it does not need to be pingable. This IP Address is used to fill the Source IP of the NetFlow packets. This IP Address allows the Netflow collector to interact with the dvSwitch as a single switch, rather than seeing a separate unrelated switch for each associated host. If this is not configured, the hosts management address is used instead.

  • Active flow export timeout

The number of seconds after which active flows (flows where packets are sent) are forced to be exported to the NetFlow collector. The default is 300 and can range from 0-3600

  • Idle flow export timeout

The The number of seconds after which idle flows (flows where no packets have been seen for x number of seconds) are forced to be exported to the collector.The default is 15 and can range from 0-300

  • Sampling Rate

The value that is used to determine what portion of data that Netflow collects. If the sampling rate is 2, it collects every other packet. If the rate is 5, the data is collected form every 5th packet. 0 counts every packet

  • Process internal flows only

Indicates whether to limit analysis to traffic that has both the source and destination virtual machine on the same host. By default the checkbox is not selected which means internal and external flows are processed. You might select this checkbox if you already have NetFlow deployed in your datacenter and you want to only see the floes that cannot be seen by your existing NetFlow collector.

After configuring Netflow on the dvSwitch, you can then enable NetFlow monitoring on a distributed Port Group or an uplink.

Dilbert

VMware Performance and resolving Issues

CPU

A short spike in CPU usage indicates that you are making the best use of the host resources. However, if the value is constantly high, the host is probably lacking the CPU required to meet the demand. A high CPU usage value can lead to increased ready time and processor queuing of the virtual machines on the host.

If the CPU usage value for a virtual machine is above 90% and the CPU ready value is above 20%, performance is being impacted.

If performance is impacted, consider taking the actions listed below

Actions

  1. Verify that VMware Tools is installed on every virtual machine on the host.
  2. Set the CPU reservations for all high-priority virtual machines to guarantee that they receive the CPU cycles required.
  3. Reduce the number of virtual CPUs on a virtual machine to only the number required to execute the workload. For example, a single-threaded application on a four-way virtual machine only benefits from a single vCPU. But the hypervisor’s maintenance of the three idle vCPUs takes CPU cycles that could be used for other work.
  4. If the host is not already in a DRS cluster, add it to one. If the host is in a DRS cluster, increase the number of hosts and migrate one or more virtual machines onto the new host.
  5. Upgrade the physical CPUs or cores on the host if necessary
  6. Use the newest version of ESX/ESXi, and enable CPU-saving features such as TCP Segmentation Offload, large memory pages, and jumbo frames.

Memory

To ensure best performance, the host memory must be large enough to accommodate the active memory of the virtual machines. Note that the active memory can be smaller than the virtual machine memory size. This allows you to over-provision memory, but still ensures that the virtual machine active memory is smaller than the host memory.
Transient high-usage values usually do not cause performance degradation. For example, memory usage can be high when several virtual machines are started at the same time or when there is a spike in virtual machine workload. However, a consistently high memory usage value (94% or greater) indicates that the host is probably lacking the memory required to meet the demand. If the active memory size is the same as the granted memory size, demand for memory is greater than the memory resources available. If the active memory is consistently low, the memory size might be too large.
If the memory usage value is high, and the host has high ballooning or swapping, check the amount of free physical memory on the host. A free memory value of 6% or less indicates that the host cannot handle the demand for memory. This leads to memory reclamation which may degrade performance.
If the host has enough free memory, check the resource shares, reservation, and limit settings of the virtual machines and resource pools on the host. Verify that the host settings are adequate and not lower than those set for the virtual machines.
If the host has little free memory available, or if you notice a degredation in performance, consider taking the actions listed

  1. Verify that VMware Tools is installed on each virtual machine. The balloon driver is installed with VMware Tools and is critical to performance.
  2. Verify that the balloon driver is enabled. The VMkernel regularly reclaims unused virtual machine memory by ballooning and swapping. Generally, this does not impact virtual machine performance.
  3. Reduce the memory space on the virtual machine, and correct the cache size if it is too large. This frees up memory for other virtual machines.
  4.  If the memory reservation of the virtual machine is set to a value much higher than its active memory, decrease the reservation setting so that the VMkernel can reclaim the idle memory for other virtual machines on the host.
  5. Migrate one or more virtual machines to a host in a DRS cluster.
  6. Add physical memory to the host.

Disk

Use the disk charts to monitor average disk loads and to determine trends in disk usage. For example, you might notice a performance degradation with applications that frequently read from and write to the hard disk. If you see a spike in the number of disk read/write requests, check if any such applications were running at that time.
The best ways to determine if your vSphere environment is experiencing disk problems is to monitor the disk latency data counters. You use the Advanced performance charts to view these statistics.

■  The kernelLatency data counter measures the average amount of time, in milliseconds, that the VMkernel spends processing each SCSI command. For best performance, the value should be 0-1 milliseconds. If the value is greater than 4ms, the virtual machines on the ESX/ESXi host are trying to send more throughput to the storage system than the configuration supports. Check the CPU usage, and increase the queue depth.

■  The deviceLatency data counter measures the average amount of time, in milliseconds, to complete a SCSI command from the physical device. Depending on your hardware, a number greater than 15ms indicates there are probably problems with the storage array. Move the active VMDK to a volume with more spindles or add disks to the LUN.

■  The queueLatency data counter measures the average amount of time taken per SCSI command in the VMkernel queue. This value must always be zero. If not, the workload is too high and the array cannot process the data fast enough.


Actions

  1. Increase the virtual machine memory. This should allow for more operating system caching, which can reduce I/O activity. Note that this may require you to also increase the host memory. Increasing memory might reduce the need to store data because databases can utilize system memory to cache data and avoid disk access.
    To verify that virtual machines have adequate memory, check swap statistics in the guest operating system. Increase the guest memory, but not to an extent that leads to excessive host memory swapping. Install VMware Tools so that memory ballooning can occur.
  2. Defragment the file systems on all guests.
  3. Disable antivirus on-demand scans on the VMDK and VMEM files.
  4. Use the vendor’s array tools to determine the array performance statistics. When too many servers simultaneously access common elements on an array, the disks might have trouble keeping up. Consider array-side improvements to increase throughput.
  5. Use Storage VMotion to migrate I/O-intensive virtual machines across multiple ESX/ESXi hosts
  6. Balance the disk load across all physical resources available. Spread heavily used storage across LUNs that are accessed by different adapters. Use separate queues for each adapter to improve disk efficiency.
  7. Configure the HBAs and RAID controllers for optimal use. Verify that the queue depths and cache settings on the RAID controllers are adequate. If not, increase the number of outstanding disk requests for the virtual machine by adjusting the Disk.SchedNumReqOutstanding parameter. For more information, see the Fibre Channel SAN Configuration Guide.
  8. For resource-intensive virtual machines, separate the virtual machine’s physical disk drive from the drive with the system page file. This alleviates disk spindle contention during periods of high use
  9.  On systems with sizable RAM, disable memory trimming by adding the line MemTrimRate=0 to the virtual machine’s .VMX file.
  10. If the combined disk I/O is higher than a single HBA capacity, use multipathing or multiple links.
  11. For ESXi hosts, create virtual disks as preallocated. When you create a virtual disk for a guest operating system, select Allocate all disk space now. The performance degradation associated with reassigning additional disk space does not occur, and the disk is less likely to become fragmented.
  12. Use the most current ESX/ESXi host hardware.

Networking

Network performance is dependent on application workload and network configuration. Dropped network packets indicate a bottleneck in the network. To determine whether packets are being dropped, use esxtop or the advanced performance charts to examine the droppedTx and droppedRx network counter values.
If packets are being dropped, adjust the virtual machine shares. If packets are not being dropped, check the size of the network packets and the data receive and transfer rates. In general, the larger the network packets, the faster the network speed. When the packet size is large, fewer packets are transferred, which reduces the amount of CPU required to process the data. When network packets are small, more packets are transferred but the network speed is slower because more CPU is required to process the data.

If packets are not being dropped and the data receive rate is slow, the host is probably lacking the CPU resources required to handle the load. Check the number of virtual machines assigned to each physical NIC. If necessary, perform load balancing by moving virtual machines to different vSwitches or by adding more NICs to the host. You can also move virtual machines to another host or increase the host CPU or virtual machine CPU.
If you experience network-related performance problems, also consider taking the actions listed below

Actions

  1. Verify that VMware Tools is installed on each virtual machine.
  2.  If possible, use vmxnet3 NIC drivers, which are available with VMware Tools. They are optimized for high performance.
  3. If virtual machines running on the same ESX/ESXi host communicate with each other, connect them to the same vSwitch to avoid the cost of transferring packets over the physical network.
  4. Assign each physical NIC to a port group and a vSwitch.
  5. Use separate physical NICs to handle the different traffic streams, such as network packets generated by virtual machines, iSCSI protocols, VMotion tasks, and service console activities.
  6.  Ensure that the physical NIC capacity is large enough to handle the network traffic on that vSwitch. If the capacity is not enough, consider using a high-bandwidth physical NIC (10Gbps) or moving some virtual machines to a vSwitch with a lighter load or to a new vSwitch.
  7. If packets are being dropped at the vSwitch port, increase the virtual network driver ring buffers where applicable.
  8. Verify that the reported speed and duplex settings for the physical NIC match the hardware expectations and that the hardware is configured to run at its maximum capability. For example, verify that NICs with 1Gbps are not reset to 100Mbps because they are connected to an older switch.
  9. Verify that all NICs are running in full duplex mode. Hardware connectivity issues might result in a NIC resetting itself to a lower speed or half duplex mode.
  10. Use vNICs that are TSO-capable, and verify that TSO-Jumbo Frames are enabled where possible

Virtual Disk Formats

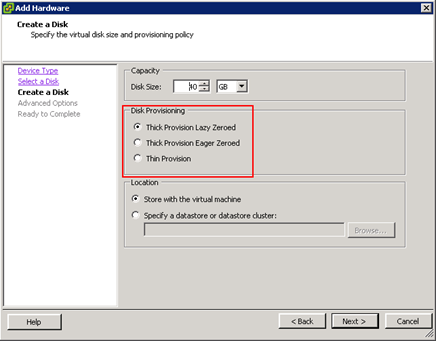
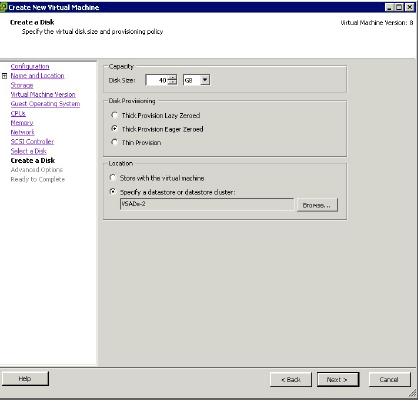
The distinguishing factor among virtual disk formats is how data is zeroed out for the boundary of the virtual disk file. Zeroing out can be done either at run time (when the write happens to that area of the disk) or at the disk’s creation time.

There are three main virtual disk formats within VMware vSphere

  1. Zeroedthick (Lazy)
  2. Eagerzeroedthick.
  3. Thin

1. Zeroedthick – The “zeroedthick” format is the default and quickly creates a “flat” virtual disk file. The Zeroed Thick option is the pre-allocation of the entire boundary of the VMDK disk when it is created. This is the traditional fully provisioned disk format. In the vSphere Client, this is the default option. The virtual disk is allocated all of its provisioned space and immediately made accessible to the virtual machine.  A lazy zeroed disk is not zeroed up front which makes the provisioning very fast. However, because each block is zeroed out before it is written to for the first time there is added latency on first write.

2. Eagerzeroed  -This pre-allocates the disk space as well as each block of the file being pre-zeroed within the VMDK. Because of the increased I/O requirement, this requires additional time to write out the VMDK but eliminates the zeroing later on . Finally, the “eagerzeroedthick” format is used/required by VMware’s new Fault Tolerance (FT) feature

3. Thin – The thin virtual disk format is perhaps the easier option to understand. This is simply an as-used consumption model. This disk format is not pre-written to disk and is not zeroed out until run time

Performance Differences

So, why is this important? For one, there may be a perceived performance implication of having the disks thin provisioned. The thin provisioning white paper by VMware explains with more detail how each of these formats are used, as well as a quantification of the performance differences of eager zeroed thick and other formats. The white paper states that the performance impact is negligible for thin provisioning, and in all situations the results are nearly indistinguishable.

http://www.vmware.com/pdf/vsp_4_thinprov_perf.pdf

VASA – VMware vSphere vStorage API’s for storage awareness

Information

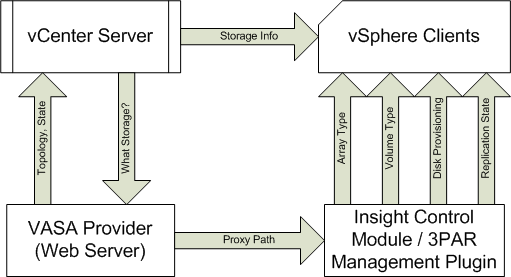
VMware vSphere vStorage API’s for storage awareness (VASA) is a set of software API’s that a storage vendor can use to provide information about their storage array to vCenter Server.

vCenter server gets the information from a storage array by using a software component called a VASA provider which is written by the storage array vendor. The VASA provider can exist on either the storage array processor or on a standalone host. The decision is made by the storage vendor. Storage devices are identified to vCenter server with a T10 identifier or an NAA ID. VMware recommends that vendors use these types of identifiers so that devices can be matched between the VASA provider and vCenter server

Information from the VASA provider is displayed in the VMware vSphere client.

What information can these API’s show?

  • Storage Topology
  • Storage Capabilities
  • State of physical storage devices
  • Health and usage of storage
  • Performance capabilities such as number and type of spindles
  • I/O Operations
  • DR Information – RPO and RTO
  • Space efficiency – Compression and Disk Format.

How does the VASA provider work?

The VASA provider acts as a server in the vSphere environment. vCenter server connects to the VASA provider to obtain information about available storage topology, capabilities and state. A VASA provider can report information about one or more storage devices and support connections to a single or multiple vCenter instances

Configuring a VASA Provider

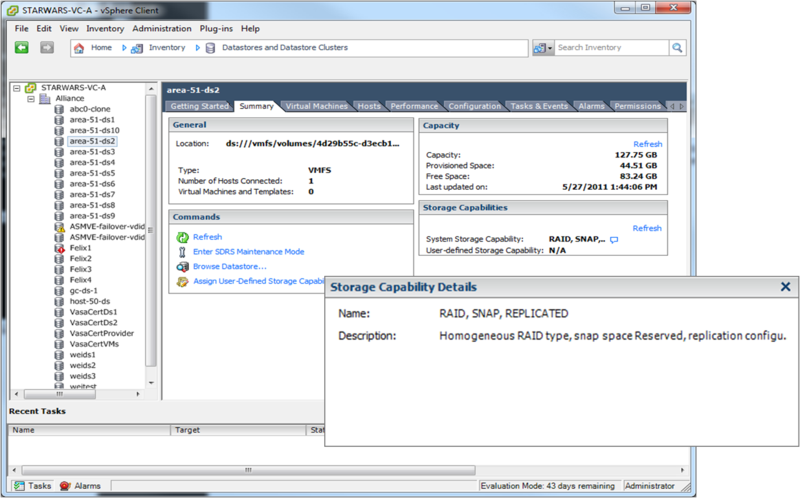
If your storage supports a VASA provider, use the vSphere Client to register and manage the VASA provider. The storage providers icon on the vSphere Client Home Page allows you to configure the VASA provider. All system storage capabilities that are presented by the VASA provider are displayed in the vSphere Client

In vSphere 5.0, a  new Storage Capabilities panel appears in the Datastore Summary tab.

Register a VASA Provider

To register a VASA provider, the storage vendor provides a URL, a login account and a password. Users log into the VASA Provider to get array informaton. vCenter Server must trust the VASA provider host. So a security certificate from the VASA provider must be installed on the vCenter server system.

LAHF and SAHF CPU Instructions

VMware ESXi 5.0 only installs and runs on servers with 64-bit x86 CPUs. It also only supports LAHF and SAHF CPU instructions. These are known 64-bit processors:

  • All AMD Opteron processors
  • All Intel Xeon 3000/3200, 3100/3300, 5100/5300, 5200/5400, 5500/5600, 7100/7300, 7200/7400, and 7500 processor

Early AMD64 and Intel 64 CPUs lacked LAHF and SAHF instructions. AMD introduced the instructions with their Athlon 64, Opteron and Turion 64 revision D processors in March 2005 while Intel introduced the instructions with the Pentium 4 G1 stepping in December 2005.

LAHF and SAHF are load and store instructions, respectively, for certain status flags. These instructions are used for virtualization and floating-point condition handling.

1. Flag Control Instructions

The flag control instructions provide a method for directly changing the state of bits in the flag register.

2. Carry and Direction Flag Control Instructions

The carry flag instructions are useful in conjunction with rotate-with-carry instructions RCL and RCR. They can initialize the carry flag, CF, to a known state before execution of a rotate that moves the carry bit into one end of the rotated operand.

The direction flag control instructions are specifically included to set or clear the direction flag, DF, which controls the left-to-right or right-to-left direction of string processing. If DF=0, the processor automatically increments the string index registers, ESI and EDI, after each execution of a string primitive. If DF=1, the processor decrements these index registers. Programmers should use one of these instructions before any procedure that uses string instructions to insure that DF is set properly

STC (Set Carry Flag) CF <- 1 CLC (Clear Carry Flag) CF <- 0 CMC (Complement Carry Flag) CF <- NOT (CF) CLD (Clear Direction Flag) DF <- 0 STD (Set Direction Flag) DF <- 1 is set properly.

3. Flag Transfer Instructions

Though specific instructions exist to alter CF and DF, there is no direct method of altering the other applications-oriented flags. The flag transfer instructions allow a program to alter the other flag bits with the bit manipulation instructions after transferring these flags to the stack or the AH register.

The instructions LAHF and SAHF deal with five of the status flags, which are used primarily by the arithmetic and logical instructions.

LAHF (Load AH from Flags) copies SF, ZF, AF, PF, and CF to AH bits 7, 6, 4, 2, and 0, respectively (see Figure below). The contents of the remaining bits (5, 3, and 1) are undefined. The flags remain unaffected.

SAHF (Store AH into Flags) transfers bits 7, 6, 4, 2, and 0 from AH into SF, ZF, AF, PF, and CF, respectively (below).

The PUSHF and POPF instructions are not only useful for storing the flags in memory where they can be examined and modified but are also useful for preserving the state of the flags register while executing a procedure.

PUSHF (Push Flags) decrements ESP by two and then transfers the low-order word of the flags register to the word at the top of stack pointed to by ESP (see Figure below). The variant PUSHFD decrements ESP by four, then transfers both words of the extended flags register to the top of the stack pointed to by ESP (the VM and RF flags are not moved, however).

POPF (Pop Flags) transfers specific bits from the word at the top of stack into the low-order byte of the flag register (see Figure below), then increments ESP by two. The variant POPFD transfers specific bits from the double word at the top of the stack into the extended flags register (the RF and VM flags are not changed, however), then increments ESP by four

4. LAHF and SAHF

LAHF loads 5 flags from the flag register into Register AH. SAHF stores these same 5 flags from AH into the Flag Register. The bit position of each flag is the same in AH as it is in the Flag Register. The remaining bits (marked 0) are reserved and you don’t define them


(VAAI) vSphere Storage APIs for Array Integration

help-sm

What is VAAI?

VAAI helps storage vendors provide hardware assistance in the form of API components to accelerate VMware I/O operations that are more efficiently run within the storage which reduces CPU in the host

How do I know if my storage array supports VAAI?

To determine if your storage array support VAAI, see the Hardware Compatibility List or consult your storage vendor.
To enable the hardware acceleration on the storage array, check with your storage vendor. Some storage arrays require explicit activation of hardware acceleration support.

vSphere 5

With vSphere 5.0, support for the VAAI capabilities has been enhanced and additional capabilities have been introduced

  1. vSphere thin provisioning – Enabling the reclamation of unused space and monitoring of space usage for thin provisioned LUNs.
  2. Hardware Acceleration for NAS – Enables NAS arrays to integrate with VMware to offload operations such as offline cloning, cold migrations and cloning from templates
  3. SCSI standardisation – T10 compliancy for full copy, block zeroing and hardware assisted locking.
  4. Hardware assisted Full Copy – Enabling the storage to make full copies of data in the array
  5. Hardware assisted Block zeroing – Enabling the array to zero out large numbers of blocks
  6. Hardware assisted locking – Providing an alternative mechanism to protect VMFS metadata

vSphere thin provisioning

Historically the 2 major challenges of thin provisoned LUNs have been the reclamation of dead space and the challenges surrounding the monitoring of space usage. VAAI thin provisoning introduces the following. For Thin Provisioning, enabling/disabling occurs on the array and not on the ESXi host

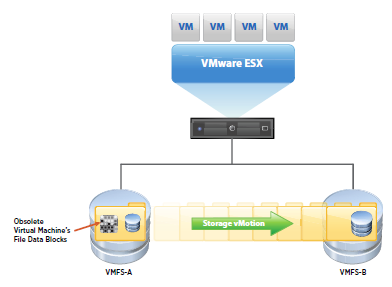
  • Dead Space reclamation informs the array about the datastore space that is freed when files/disks are deleted or removed from the datastore by general deletion or storage vMotion. The array then reclaims the space

  • Out of Space Condition monitors the space on thin provisioned LUNs to prevent running out of space. A new advanced warning has been added to vSphere


 Hardware Acceleration for NAS

Hardware acceleration for NAS will enable faster provisioning and the use of thick virtual disks through new VAAI capabilities

  • Full File Clone – Similar to Full Copy. Enables virtual disks to be cloned by the NAS Device
  • Reserve Space – Enables creation of thick virtual disk files on NAS
  • Lazy File Clone- Emulates the Linked Clone functionality on VMFS datastores. Allows the NAS device to create native snapshots to conserve space for VDI environments.
  • Extended Statistics – Provides more accurate space reporting when using Lazy File Clone

Prior to vSphere 5, a virtual disk was created as a thin provisioned disk, not even enabling the creation of a thick disk. Starting with vSphere 5, VAAI NAS extensions enable NFS vendors to reserve space for an entire virtual disk.

SCSI standardisation – T10 compliancy for full block, block zeroing and hardware assisted locking

vSphere 4.1 introduced T10 compliancy for block zeroing enabling vendors to utilise the T10 standards with the default shipped plugin. vSphere 5 introduces enhanced support for T10 enabling the use of VAAI capabilities without the need to install a plug-in as well as enabling support for many storage devices.

Hardware-Accelerated Full Copy

Enables the storage array to make complete copies of a data set without involving the ESXi host, thereby reducing storage (and network traffic depending on your configuration) traffic between the host and the array. The XSET command offloads the process of copying VMDK blocks which can reduce the time in cloning, deploying from templates and svMotions of VMs.

Hardware-Accelerated Block Zeroing

This feature enables the storage array to zero out a large number of blocks. This eliminates redundant host write commands. Performance improvements can be seen related to creating VMs and formatting virtual disks

Hardware Assisted Locking

Permits VM level locking without the use of SCSI reservations, using VMware’s Compare and Write command. Enables disk locking per sector as opposed to the entire LUN, providing a more efficient way to alter a metadata related file. This feature improves metadata heavy operations, such as concurrently powering on multiple VMs.

How do I know if VAAI is enabled through the vClient?

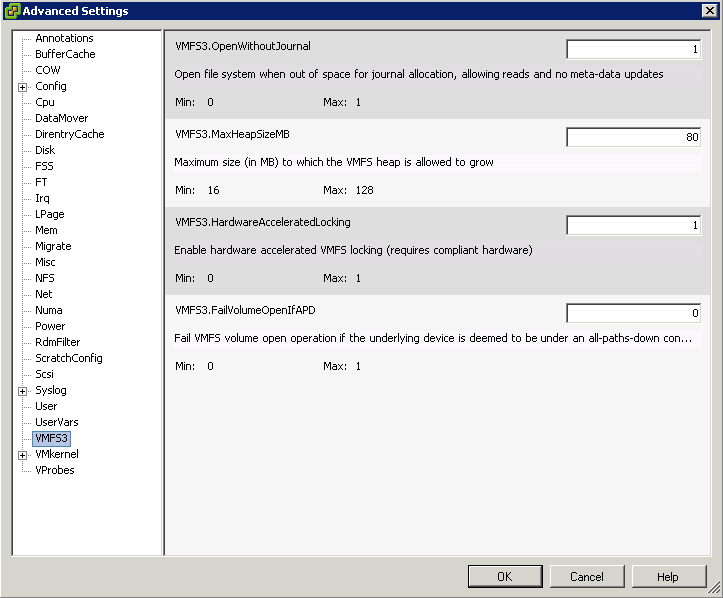
  • In the vSphere Client inventory panel, select the host
  • Click the Configuration tab, and click Advanced Settings under Software.
  • Click VMFS3
  • Select VMFS3.HardwareAcceleratedLocking
  • Check that this option is set to 1 (enabled)

vaai

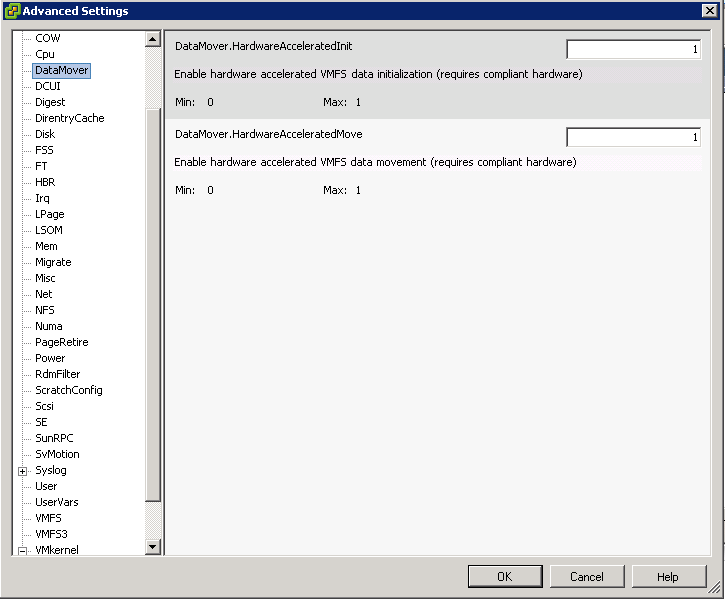
  • Click DataMover
  • DataMover.HardwareAcceleratedMove
  • DataMover.HardwareAcceleratedInit

datamover

  • Note: These 3 options are enabled by default.

vaai

How do I know if VAAI is enabled through the command line

  • Type the following commands
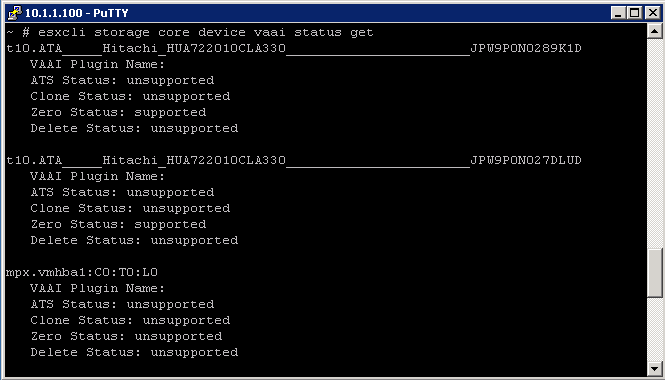
  • esxcli storage core device vaai status get -d naa.abcdefg
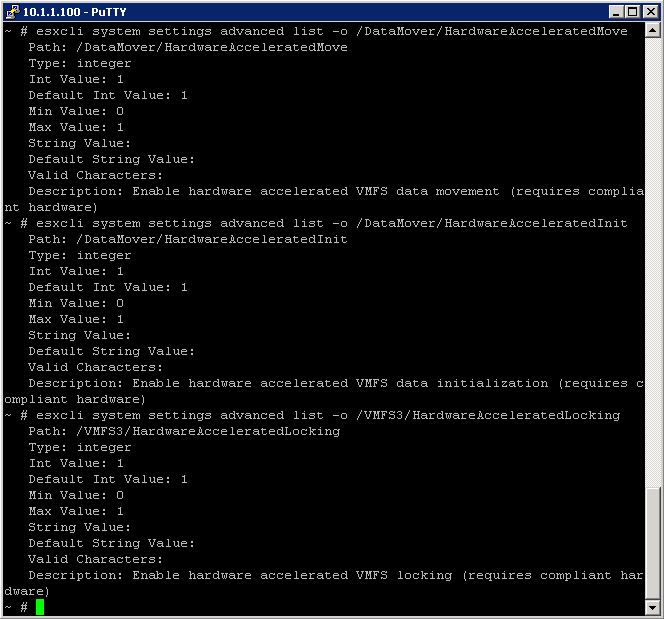
  • esxcli system settings advanced list -o /DataMover/HardwareAcceleratedMove
  • esxcli system settings advanced list -o /DataMover/HardwareAcceleratedInit
  • esxcli system settings advanced list -o /VMFS3/HardwareAcceleratedLocking
  • esxcli storage core plugin list -N VAAI – displays plugins for VAAI
  • esxcli storage core plugin list -N Filterdisplays VAAI filter

Examples

To check the VAAI Status

Capture

To determine if VAAI is enabled, check is Int Value is set to 1

VAAI

What happens if I have VAAI enabled on the host but some of my disk arrays do not support it?

When storage devices do not support or provide only partial support for the host operations, the host reverts to its native methods to perform the unsupported operations.

Hardware Acceleration Support Status

For each storage device and datastore, the vSphere Client displays the hardware acceleration support status in the Hardware Acceleration column of the Devices view and the Datastores view. The status values are

  • Unknown
  • Supported
  • Not Supported

The initial value is Unknown. The status changes to Supported after the host successfully performs the offload operation. If the offload operation fails, the status changes to Not Supported. When storage devices do not support or provide only partial support for the host operations, your host reverts to its native methods to perform unsupported operations

How to add Hardware Acceleration Claim Rules

To implement the hardware acceleration functionality, the Pluggable  Storage Architecture (PSA) uses a combination of special array  integration plug-ins, called VAAI plug-ins, and an array integration  filter, called VAAI filter. The PSA automatically attaches the VAAI  filter and vendor-specific VAAI plug-ins to those storage devices that  support the hardware acceleration

You need to add two claim rules, one for the VAAI filter and another for the VAAI plug-in. For the new claim rules to be active, you first define the rules and then load them into your system.

  • Define a new claim rule for the VAAI filter
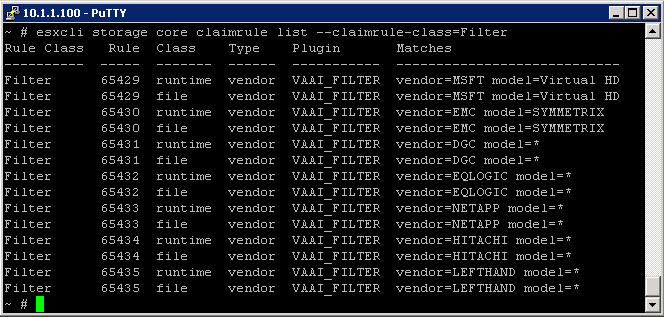
  • esxcli –server servername storage core claimrule add –claimrule-class=Filter –plugin=VAAI_FILTER
  • Define a new claim rule for the VAAI plug-in
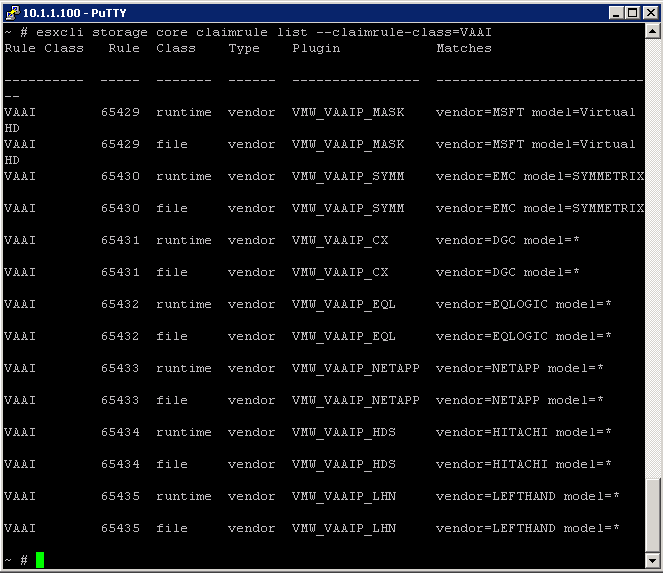
  • esxcli –server servername storage core claimrule add –claimrule-class=VAAI
  • Load both claim rules by running the following commands:
  • esxcli –server servername storage core claimrule load –claimrule-class=Filter
  • esxcli –server servername storage core claimrule load –claimrule-class=VAAI
  • Run the VAAI filter claim rule, Only this one needs to be loaded
  • esxcli –server servername storage core claimrule run –claimrule-class=Filter

Examples

VAAI2

VAAI3

Installing a NAS plug-in

  • Place your host into the maintenance mode.
  • Get and set the host acceptance level
  • esxcli software acceptance get
  • esxcli software acceptance set –level=value
  • The value can be one of the following: VMwareCertified, VMwareAccepted, PartnerSupported, CommunitySupported. Default is PartnerSupported
  • Install the VIB package
  • esxcli software vib install -v|–viburl=URL
  • The URL specifies the URL to the VIB package to install. http:, https:, ftp:, and file: are supported.
  • Verify the Plugin is installed
  • esxcli software vib list
  • Reboot your host

VMware Memory Explained

Great pic showing Memory calculations from VMware