Prepare storage for maintenance

under_maintenance

Sometimes you will need to perform maintenance on a Datastore which will require placing it in Maintenance Mode and unmounting/remounting it

When you unmount a datastore, it remains intact, but can no longer be seen from the hosts that you specify. The datastore continues to appear on other hosts, where it remains mounted

Instructions

  1. Click Hosts and Clusters View from Home
  2. Select the Host with the attached datastore
  3. Click the Configuration tab
  4. Click on Storage within the Hardware frame
  5. Locate the Datastore to unmount
  6. Right click the datastore and select Properties
  7. Uncheck Enabled under Storage I/O Control and then click Close
  8. Right click the datastore and select Enter SDRS Maintenance Mode
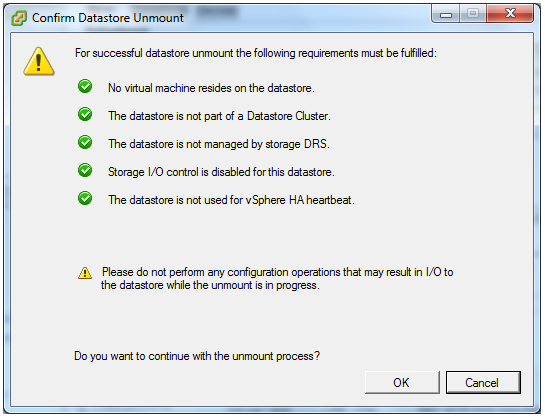
  9. Right Click the Datastore and select Unmount. You should be greeted by this screen warning

unmount

  • Note: The Detach function must be performed on a per-host basis and does not propagate to other hosts in vCenter Server. If a LUN is presented to an initiator group or storage group on the SAN, the Detach function must be performed on every host in that initiator group before unmapping the LUN from the group on the SAN. Failing to follow this step results in an all-paths-down (APD) state for those hosts in the storage group on which Detach was not performed for the LUN being unmapped

Unmounting a LUN from the command line

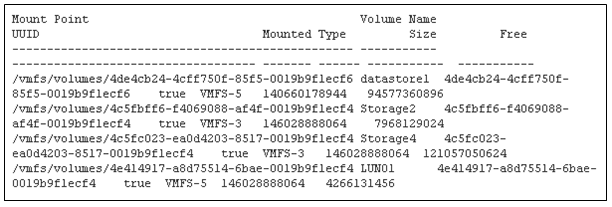
  • Type esxcli storage filesystem list
  • The output will look like the below

unmount2

  • Unmount the datastore by running the command:
  • esxcli storage filesystem unmount [-u UUID | -l label | -p path ]
  • For example, use one of these commands to unmount the LUN01 datastore:

esxcli storage filesystem unmount -l LUN01

esxcli storage filesystem unmount -u 4e414917-a8d75514-6bae-0019b9f1ecf4

esxcli storage filesystem unmount -p /vmfs/volumes/4e414917-a8d75514-6bae-0019b9f1ecf4

  • To verify that the datastore has been unmounted, run the command:
  • esxcli storage filesystem list
  • The output is similar to:

unmount4

  • Note that the Mounted field is set to false, the Type field is set to VMFS-unknown version, and that no Mount Point exists.
  • Note: The unmounted state of the VMFS datastore persists across reboots. This is the default behavior. However, it can be changed by appending the –no-persist flag.

VMware Link

http://kb.vmware.com/selfservice/microsites/search.do?language=en_US&cmd=displayKC&externalId=2004605


Configure and Administer Profile Driven Storage

What is Profile Driven Storage?

Profile Driven Storage enables the creation of Datastores that provide different levels of service. You can use Virtual Machine storage profiles and storage capabilities to ensure storage provides different levels of

  • Capacity
  • Performance
  • Availability
  • Redundancy

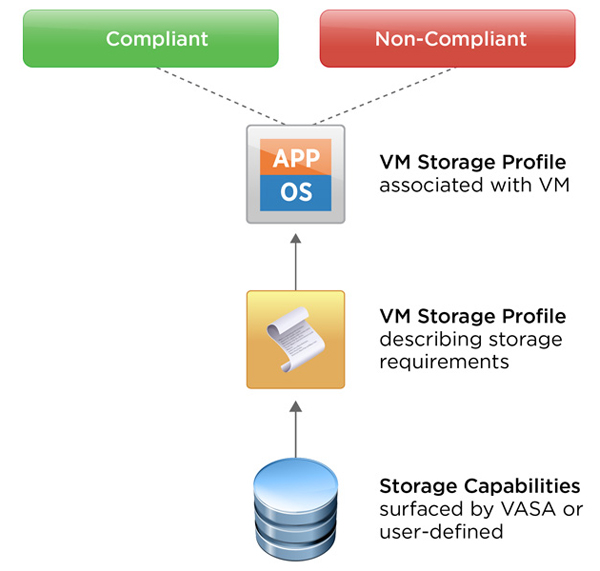
By doing this we create levels of compliance the Virtual Machines are linked to in order to maintain ongoing management and placed on storage that is suitable for its use.

storageprofile0

Profile driven storage is composed of 2 components where a user defined capability can be used alongside a Storage capability.

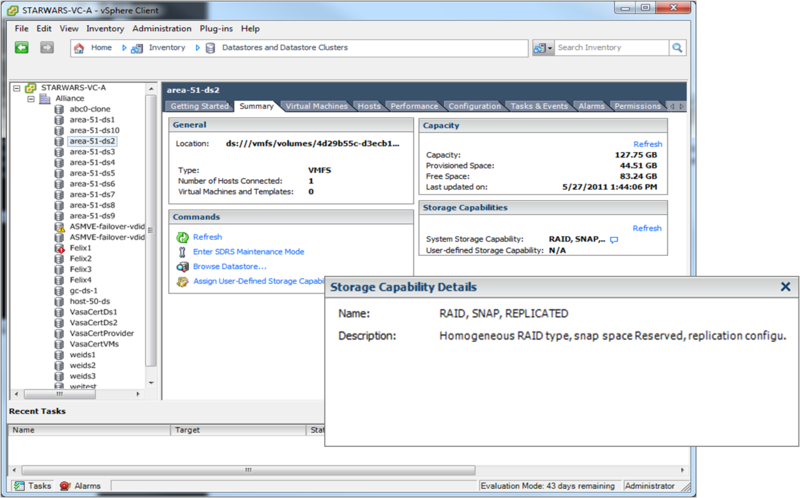
  • Storage capabilities which details the features that a storage system offers provided by a VASA Vendor provider
  • User defined capabilities which can be associated with multiple datastores

storageprofile

Instructions for creating Profile Driven Storage

A VM storage profile is attached to a Storage capability. In turn a Storage Capability profile is attached to a datastore.

  • View the System defined storage capabilities that your storage system defines

vasa

  • Create a user-defined storage capability for your Virtual Machines
  • Go to VM Storage Profiles in vCenter

Capture

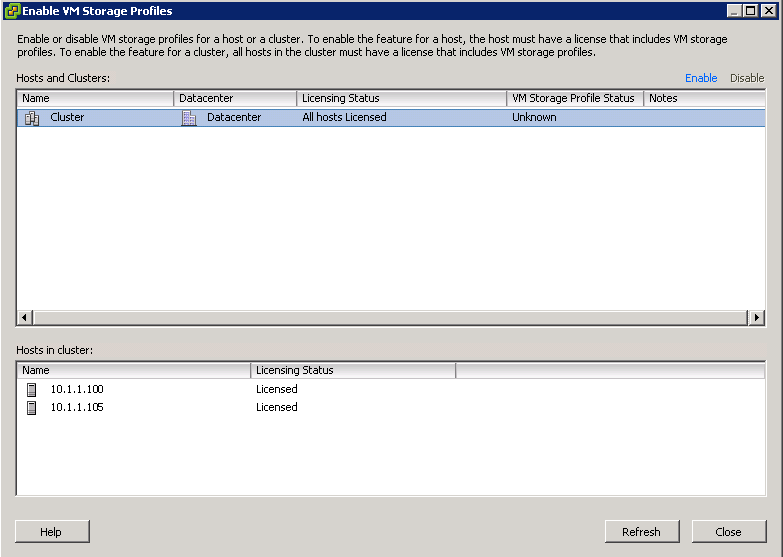
  • Click Enable VM Storage Profiles

Capture2

  • View the box which appears and enable these for a host or a cluster and click Close

Capture3

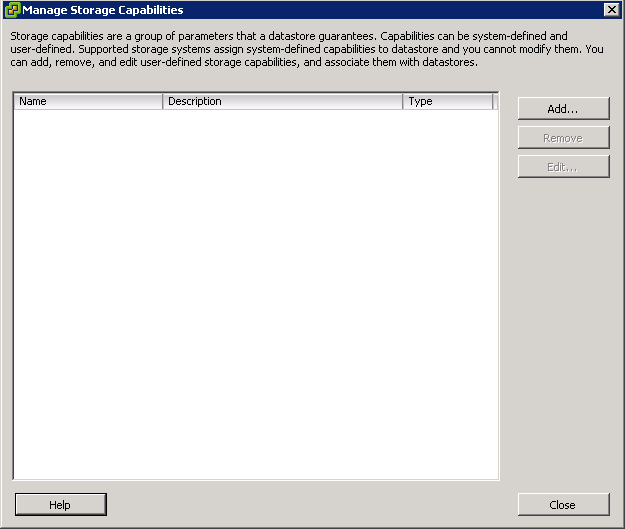
  • Click Manage Storage Capabilities

Capture4

  • Click Add
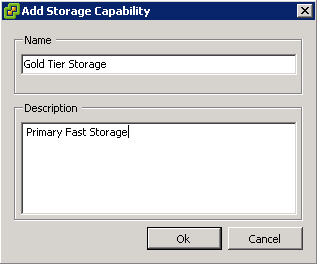
  • Type a name for your storage capability. E.g Gold Storage, Silver Storage, Replicated Storage
  • Add a description if you want and click OK

Capture5

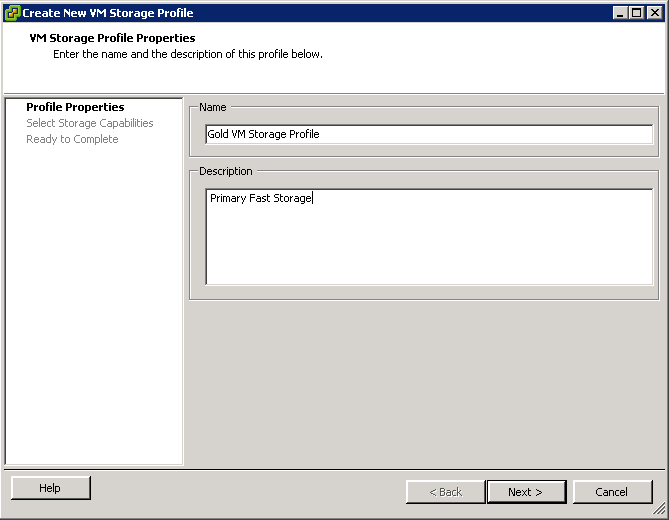
  • Next click Create VM Storage Profile
  • Type a name and a description

Capture6

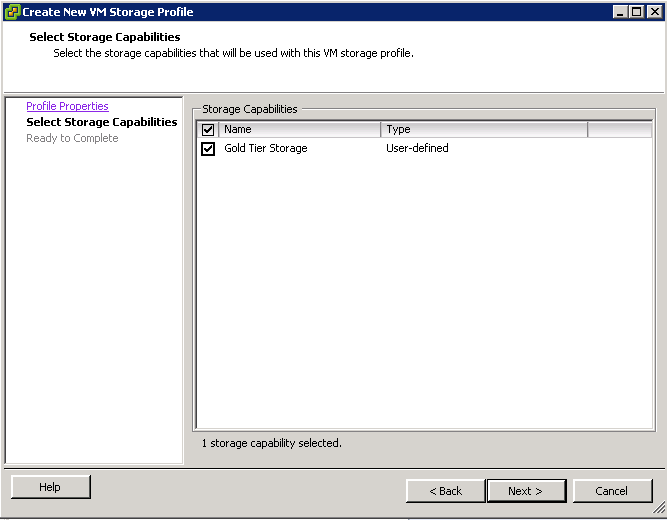
  • Select the Storage capability you require from what we created at the start of these instructions. E.g Gold Storage, Silver Storage, Replicated Storage

Capture7

  • Click Next and Finish
  • Go to Datastores and Datastore Clusters
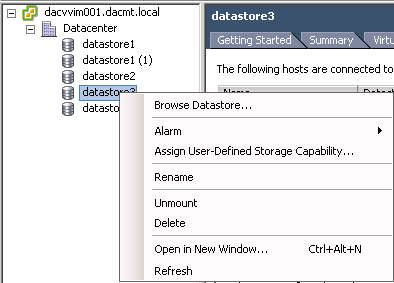
  • Right click a Datastore and select Assign User Defined Storage Capability

Capture8

  • Select the capability you created.
  • Now you can create a VM and within the setup wizard on the storage tab, you can select a storage profile to use which will immediately show you which Datastores are compatible and which ones are not
  • On a VM you can also see from the summary tab whether the profile is compliant or not as per below screenprint

compliant

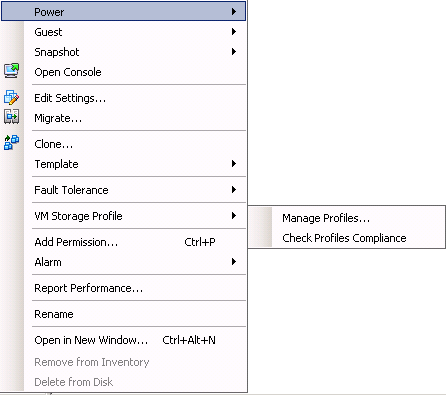
  • And you can also right click on a VM and manage a profile or check profile compliance

Capture10

Resolving Non Compliant VMs

A non-compliant machine must storage migrate the virtual disks it owns:

  • Enter the Host and Clusters view
  • Select a non-compliant virtual machine
  • Right-Click the Virtual Machine and click Migrate
  • On the migration type screen, click Change Datastore, click Next
  • On the storage screen, optionally select the new disk format for post-migration
  • Select the VM Storage Profile to bring into compliance for the non-compliant VM.
  • If you are migrating an individual virtual disk within a VM, Click Advanced
  • Select the virtual disk you want to move to the new storage profile and then click the Browse under the Datastore column
  • Verify that the VM Storage Profile is correct, if not select the appropriate VM Storage Profile
  • Select a Compatible Datastore Cluster to place your non-compliant virtual disk
  • Optionally, you may disable SDRS for this virtual machine
  • Click OK
  • Click Next
  • Verify your settings at the completion screen and select show all storage recommendations
  • Verify that you agree with the migration recommendations and then click Apply Recommendations
  • Repeat the section above, Check Storage Profile Compliance

Identify and tag SSD Devices

SSD

You can use PSA SATP claim rules to tag SSD devices that are not detected automatically.
Only devices that are consumed by the PSA Native Multipathing (NMP) plugin can be tagged.

Procedure

First find all your relevant information

  • Identify the drive to be tagged and its SATP.
  • For example our drive is called (naa.600605b008f362e01c91d3154a908da1):1
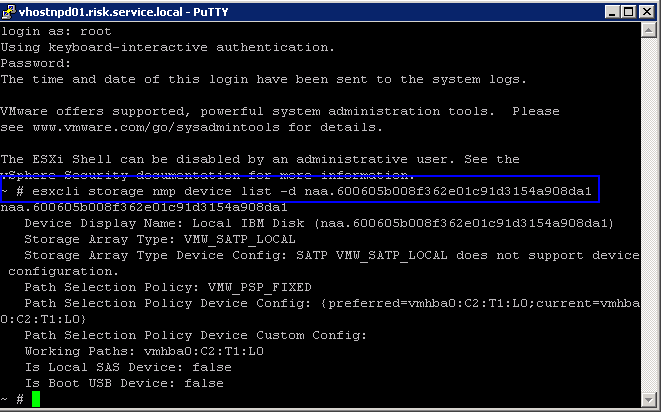
  • Type esxcli storage nmp device list -d naa.600605b008f362e01c91d3154a908da1
  • The command results in the following information.

SSDTagging

  • Note down the SATP associated with the device.
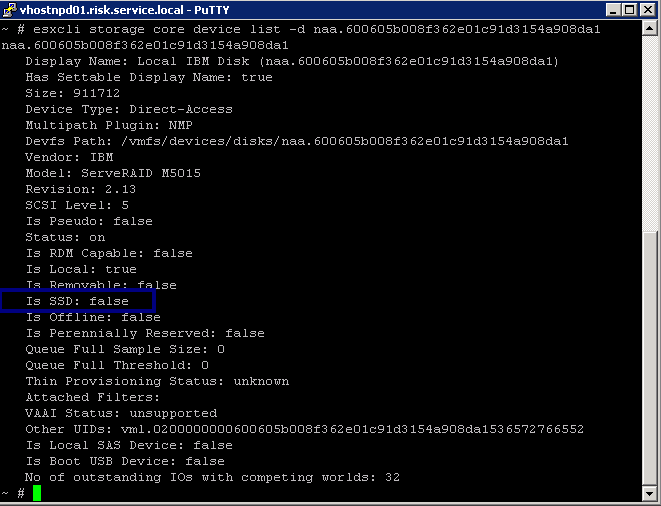
  • You can also run the following to get extra information and you can see that Is SSD is marked false when it should be true
  • esxcli storage core device list -d naa.600605b008f362e01c91d3154a908da1

SSDTagging2

Create a new SATP Rule

  • Add a PSA claim rule to mark the device as SSD.
  • There are several ways to do this
  • You can add a claim rule by specifying the device name.
  • esxcli storage nmp satp rule add -s VMW_SATP_CX -d naa.600605b008f362e01c91d3154a908da1 -o enable_ssd

SSDTagging4

  • You can add a claim rule by specifying the vendor name and the model name.
    esxcli storage nmp satp rule add -s VMW_SATP_CX -V vendor_name -M model_name –option=enable_ssd
  • You can add a claim rule based on the transport protocol.
  • esxcli storage nmp satp rule add -s VMW_SATP_CX  –transport transport_protocol –option=enable_ssd
  • You can add a claim rule based on the driver name.
  • esxcli storage nmp satp rule add -s VMW_SATP_CX  –driver driver_name –option=enable_ssd

Restart the host

  • You now need to restart the host

Unclaiming the device

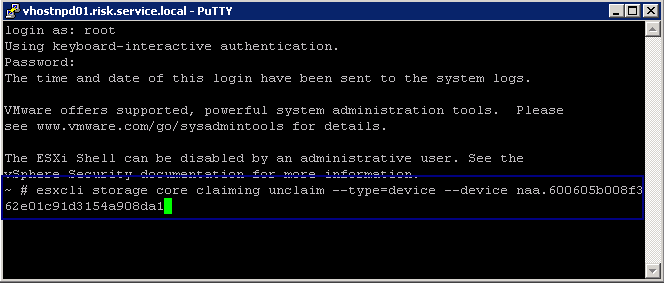
  • You can now unclaim the device by specifying the device name.
  • esxcli storage core claiming unclaim –type device –device naa.600605b008f362e01c91d3154a908da1

SSDTagging5

  • You can unclaim the device by specifying the vendor name and the model name.
  • esxcli storage core claiming unclaim –type device -V vendor_name -M model_name
  • You can unclaim the device based on the transport protocol.
  • esxcli storage core claiming unclaim –type device –transport transport_protocol
  • You can unclaim the device based on the driver name.
  • esxcli storage core claiming unclaim –type device –driver driver_name

Reclaim the device by running the following commands.

  • esxcli storage core claimrule load
  • esxcli storage core claimrule run
  • esxcli storage core claiming reclaim -d naa.600605b008f362e01c91d3154a908da1

Verify if devices are tagged as SSD.

  • esxcli storage core device list -d device_name
  • or
  • esxcli storage core device list -d naa.600605b008f362e01c91d3154a908da1 |grep SSD

SSDTagging6

The command output indicates if a listed device is tagged as SSD.

  • Is SSD: true

What to do next

If the SSD device that you want to tag is shared among multiple hosts, make sure that you tag the device from all the hosts that share the device.

Useful Link

http://kb.vmware.com/selfservice/microsites/search.do?language=en_US&cmd=displayKC&externalId=2013188

Analyse I/O Workloads to determine storage Performance Requirements

What causes Storage Performance issues?

Poor storage performance is generally the result of high I/O latency, but what can cause high storage performance and how to address it? Below are a list of things that can cause poor storage performance

Analysis of storage system workloads is important for a number of reasons. The analysis might be performed to understand the usage patterns of existing storage systems. It is very important for the architects to understand the usage patterns when designing and developing a new, or improving upon the existing design of a storage system. It is also important for a system administrator to understand the usage patterns when configuring and tuning a storage system

  • Under sized storage arrays/devices unable to provide the needed performance
  • I/O Stack Queue congestion
  • I/O Bandwidth saturation, Link/Pipe Saturation
  • Host CPU Saturation
  • Guest Level Driver and Queuing Interactions
  • Incorrectly Tuned Applications

Methods of determining Performance Requirements

There are various tools which can give us insight into how our applications are performing on a virtual infrastructure as listed below

  • vSphere Client Counters
  • esxstop/resxtop
  • vscsistats
  • Iometer
  • I/O Analyzer (VMware Fling)

vSphere Client Counters

The most significant counters to monitor for disk performance are

  • Disk Throughput (Disk Read Rate/Disk Write rate/Disk Usage) Monitored per LUN or per Host
  • Disk Latency (Physical Device Write Latency/Physical Device Write Latency no greater than 15ms and Kernel disk Read Latency/Kernel Disk Write Latency no greater than 4ms
  • Number of commands queued
  • Number of active disk commands
  • Number of aborted disk commands (Disk Command Aborts)

ESXTOP/RESXTOP

The most significant counters to monitor for disk performance are below and can be monitored per HBA

  • READs/s – Number of Disk Reads/s
  • WRITEs/s – Number of Disk Writes/s
  • MBREAD/s – MB read per second
  • MBWRN/s – MB written per second
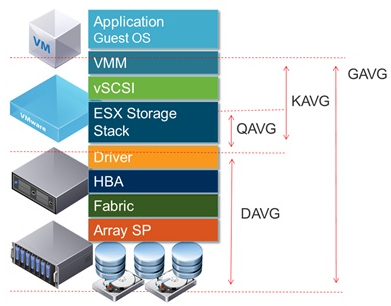
  • GAVG (Guest Average Latency) total latency as seen from vSphere. GAVG is made up of KAVG and DAVG
  • KAVG (Kernel Average Latency) time an I/O request spent waiting inside the vSphere storage stack. Should be close to 0 but anything greater than 2 ms may be a performance problem
  • QAVG (Queue Average latency) time spent waiting in a queue inside the vSphere Storage Stack.
  • DAVG (Device Average Latency) latency coming from the physical hardware, HBA and Storage device. Should be less than 10
  • ACTV – Number of active I/O Operations
  • QUED – I/O operations waiting to be processed. If this is getting into constant double digits then look carefully as the storage hardware cannot keep up with the host
  • ABRTS – A sign of an overloaded system

stroage2

vscsiStats

Since ESX 3.5, VMware has provided a tool specifically for profiling  storage: vscsiStats.  vscsiStats collects and reports counters on  storage activity.  Its data is collected at the virtual SCSI device  level in the kernel.  This means that results are reported per VMDK (or  RDM) irrespective of the underlying storage protocol.  The following  data are reported in histogram form:

  • IO size
  • Seek distance
  • Outstanding IOs
  • Latency (in microseconds)

vscsiStats Command Options

  • -l – Lists running virtual machines and their world (worldGroupID)
  • -s – Starts vscsiStats data collection
  • -x Stops vscsiStats data collection
  • -p – Prints histogram information ( all, ioLength, seekDistance, outstandingIOs, latency, interarrival)
  • -c – Produces results in a comma-delimted list
  • -h – Displays the hep menu for more info
  • seekDistance is the distance in logical block numbers (LBN) that the disk head must travel to read or write a block. If a concentration of your seek distance is very small (less than 1), then the data is sequential in nature. If the seek distance is varied, your level of randomization may be proportional to this distance traveled
  • interarrival is the amount of time in microseconds between virtual machine disk commands.
  • latency is the time of the I/O trip.
  • ioLength is the size of the I/O. This is useful when you are trying to determine how to layout your disks or how to optimize the performance of the guest O/S and applications running on the virtual machines.
  • outstandingIOs will give you an idea of any queuing that is occurring.

Instructions

I found vscsiStats in the following locations

/usr/sbin

/usr/lib/vmware/bin

  • Determine the world number for your virtual machine
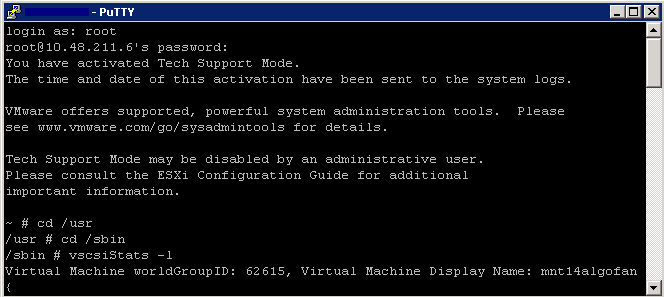
  • Log into an SSH session and type
  • cd /usr
  • cd /sbin
  • vscsiStats -l
  • Record the world ID for the virtual machine you would like to monitor
  • As per example below – 62615

Capture

  • Next capture data for your virtual machine
  • vscsiStats -s -w (worldgroup ID)
  • vscsiStats -s – w 62615
  • Although vscsiStats exits, it is still gathering data

putty

  • Once it has started, it will automatically stop after 30 minutes
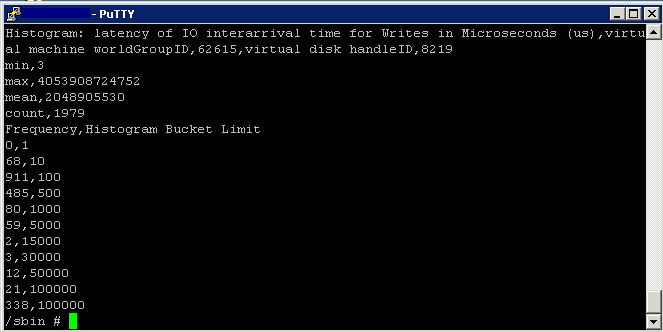
  • Type the below command to display histograms for all in a comma-delimited list
  • vscsiStats -p all -c
  • You will see many of these histograms listed

putty3

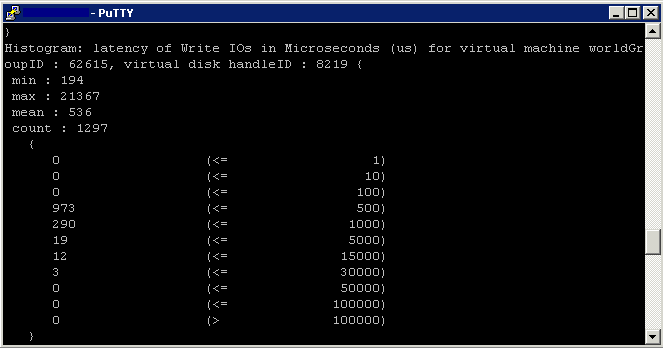
  • Type the following to show the latency histogram
  • vscsiStats -p latency

putty2

  • You can also run vscsiStats and output to a file
  • vscsiStats -p latency > /tmp/vscsioutputfile.txt
  • To manually stop the data collection and reset the counters, type the following command
  • vscsStats -x -w 62615
  • To reset all counters  to zero, run
  • vscsiStats -r

Iometer

What is Iometer?

http://www.electricmonk.org.uk/2012/11/27/iometer/

Iometer is an I/O subsystem measurement and characterization tool for single and clustered systems. It is used as a benchmark and troubleshooting tool and is easily configured to replicate the behaviour of many popular applications. One commonly quoted measurement provided by the tool is IOPS

Iometer can be used for measurement and characterization of:

  • Performance of disk and network controllers.
  • Bandwidth and latency capabilities of buses.
  • Network throughput to attached drives.
  • Shared bus performance.
  • System-level hard drive performance.
  • System-level network performance.

I/O Analyzer (VMware Fling)

http://labs.vmware.com/flings/io-analyzer

VMware I/O Analyzer is a virtual appliance solution, which provides a simple and standardized way of measuring storage performance in VMware vSphere virtualized environments. I/O Analyzer supports two types of workload generator: IOmeter for synthetic workload and trace replay for real-world application workload. It collects both guest level statistics as well as the host level statistics via VMware VI SDK. Standardizing load generation and stats collection increases the confidence of the customer and VMware engineers in the data collected. It also ensures completeness of data collected

Understand and apply LUN masking using PSA-related commands

index

What is LUN Masking?

LUN (Logical Unit Number) Masking is an authorization process that makes a LUN available to some hosts and unavailable to other hosts.LUN Masking is implemented primarily at the HBA (Host Bus Adapter) level. LUN Masking implemented at this level is vulnerable to any attack that compromises the HBA. Some storage controllers also support LUN Masking.

LUN Masking is important because Windows based servers attempt to write volume labels to all available LUN’s. This can render the LUN’s unusable by other operating systems and can result in data loss.

How to MASK on a VMware ESXi Host

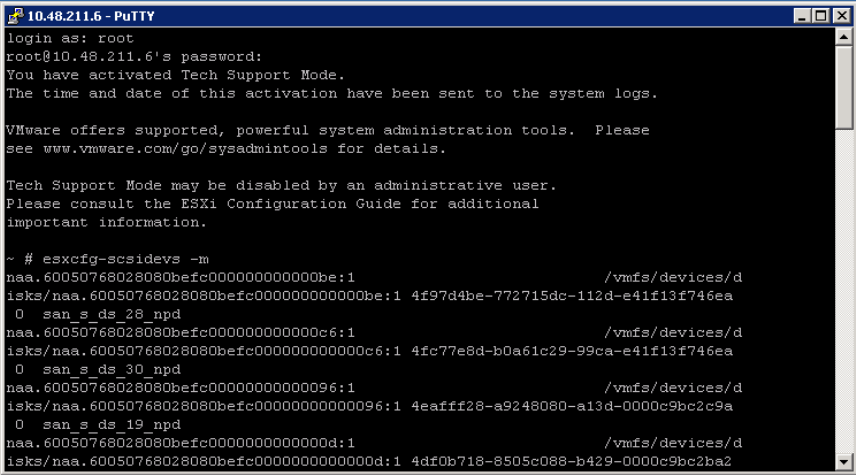
  • Step 1: Identifying the volume in question and obtaining the naa ID
  • Step 2: Run the esxcli command to associate/find this naa ID with the vmhba identifiers
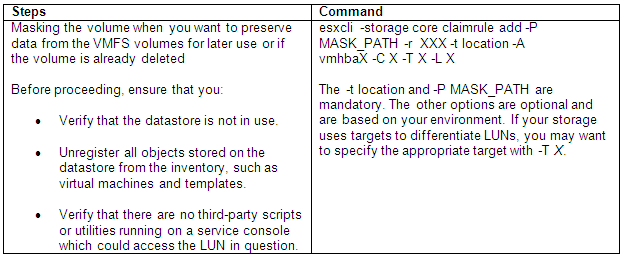
  • Step 3: Masking the volume when you want to preserve data from the VMFS volumes for later use or if the volume is already deleted
  • Step 4: Loading the Claim Rules
  • Step 5: Verify that the claimrule has loaded:
  • Step 6: Unclaim the volume in question
  • Step 7: Check Messages
  • Step 8: Unpresent the LUN
  • Step 9: Rescan all hosts
  • Step 10 Restore normal claim rules
  • Step 11: Rescan Datastores

Step 1

  • Check in both places as listed in the table above that you have the correct ID
  • Note: Check every LUN as sometimes VMware calls the same Datastore different LUN Numbers and this will affect your commands later

claim3

  • Example Below

LUN

  • Make a note of the naa ID

Step 2

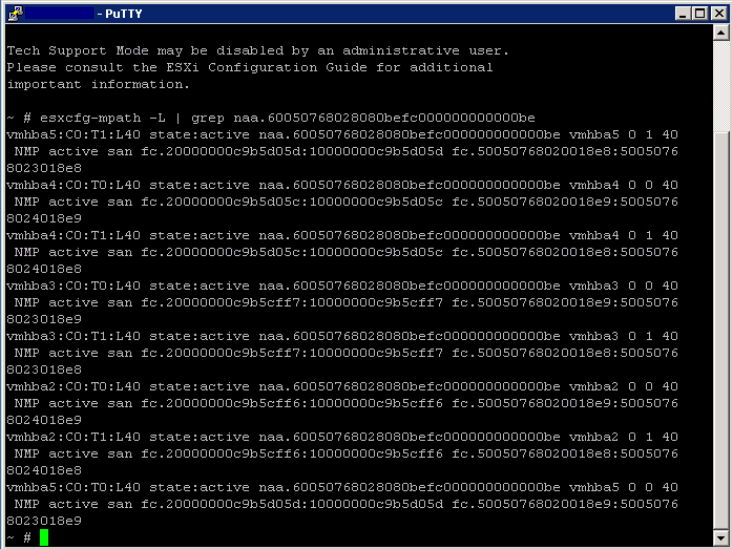
  • Once you have the naa ID from the above step, run the following command
  • Note we take the : off
  • -L parameter will show a compact list of paths

CLAIM2

  • Example below

lun3

  • We can see there are 2 paths to the LUN called C0:T0:L40 and C0:T1:L40
  • C=Channel, T=Target, L=LUN
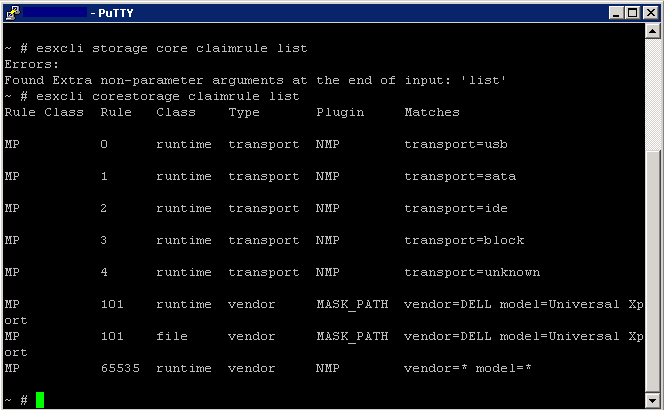
  • Next we need to check and see what claim rules exist in order to not use an existing claim rule number
  • esxcli storage core claimrule list
  • Note I had to revert to the vSphere 4 CLI command as I am screenprinting from vSphere 5 not 4!

claimrule

Step 3

  • At this point you should be absolutely clear what LUN number you are using!

claim4

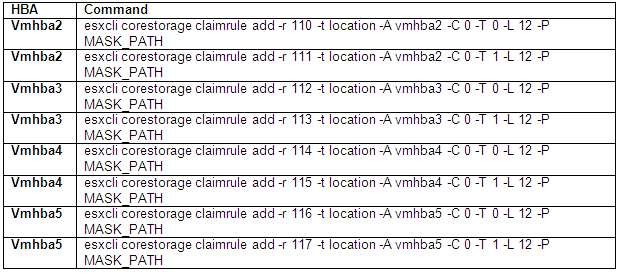
  • Next, you can use any rule numbers for the new claim rule that isn’t in the list above and pretty much anything from 101 upwards
  • In theory I have several paths so i should do this exercise for all of the paths

claim5

Step 4

claim6

  • The Class for those rules will show as file which means that it is loaded in /etc/vmware/esx.conf but it isn’t yet loaded into runtime.

Step 5

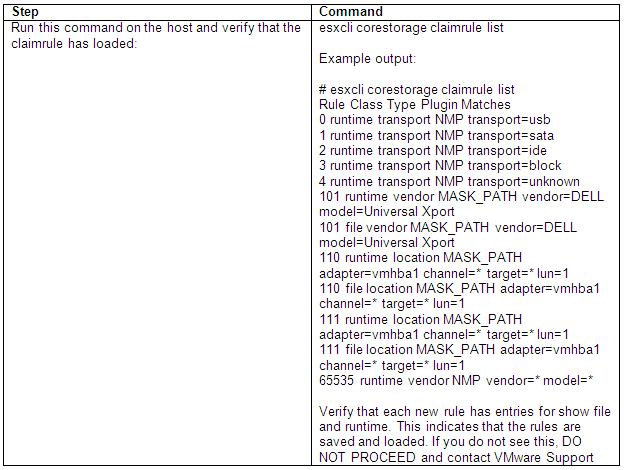
claim

  • Run the following command to see those rules displayed twice, once as the file Class and once as the runtime Class

Step 6

claim8

  • Before these paths can be associated with the new plugin (MASK_PATH), they need to be disassociated from the plugin they are currently using. In this case those paths are claimed by the NMP plugin (rule 65535). This next command will unclaim all paths for that device and then reclaim them based on the claimrules in runtime.

claim

Step 7

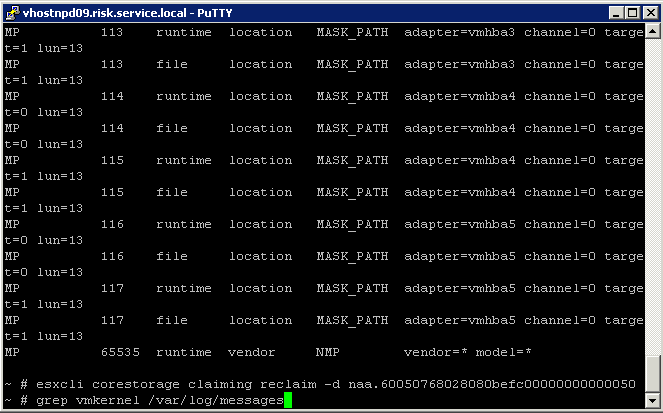
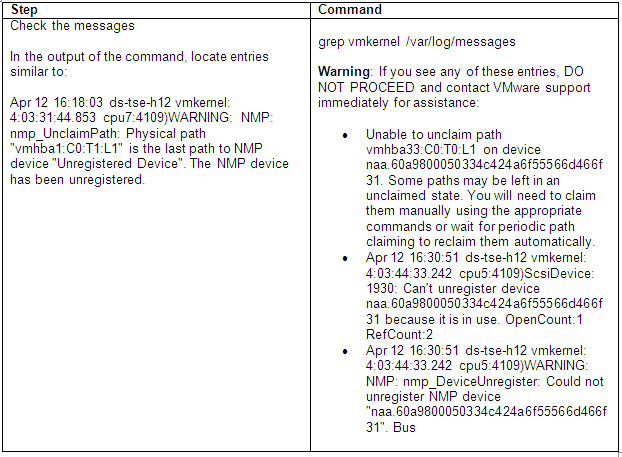
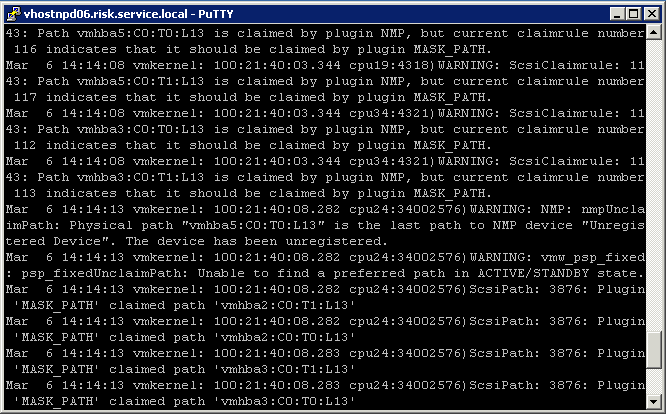
  • Check Messages

claim9

  • See example below

grep

  • Refresh the Datastore and you should see it vanish from the host view
  • Run the following command to check it now shows no paths
  • esxcfg-mpath -L | grep naa.60050768028080befc00000000000050 again will now show no paths

Step 8

  • Now get your Storage Team to remove the LUN from the SAN

Step 9

  • Rescan all hosts and make sure the Datastore has gone

Step 10

  • To restore normal claimrules, perform these steps for every host that had visibility to the LUN, or from all hosts on which you created rules earlier:

claim10

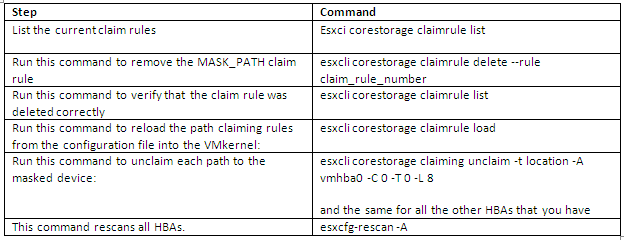
  • Run esxcli corestorage claimrule load
  • Run esxcli corestorage claimrule list
  • Note that you do not see/should not see the rules that you created earlier.

claimrule

  • Perform a rescan on all ESX hosts that had visibility to the LUN. If all of the hosts are in a cluster, right-click the cluster and click Rescan for Datastores. Previously masked LUNs should now be accessible to the ESX hosts

Step 11

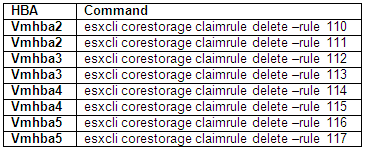
  • Next you may have to follow the following KB Article if you find you have these messages in the logs or you cannot add new LUNs
  • Run the following commands on all HBA Adapters

unclaim

Useful Video of LUN Masking

http://www.youtube.com/watch?feature=player_embedded&v=pyNZkZmTKQQ

Useful VMware Docs (ESXi4)

http://kb.vmware.com/selfservice/microsites/search.do?language=en_US&cmd=displayKC&externalId=1029786

http://kb.vmware.com/selfservice/microsites/search.do?language=en_US&cmd=displayKC&externalId=1015252

Useful VMware Doc (ESXi5)

http://kb.vmware.com/selfservice/microsites/search.do?cmd=displayKC&docType=kc&docTypeID=DT_KB_1_1&externalId=2004605


Understand and apply VMFS resignaturing

VMFS LUN UUID

Every VMFS based LUN is assigned a Universally Unique Identifier (UUID). The UUID is stored in the metadata of your file system called a superblock and is a unique hexadecimal number generated by VMware.

When a LUN is copied or a replication made of an original LUN, the copied LUN ends up being absolutely identical to the original LUN including having the same UUID. This means the newly copied LUN must be resignatured before it is mounted. ESXi can determine whether a LUN contains a VMFS copy and does not mount it automatically

VMFS resignaturing does not apply to NFS Datastores

VMFS Resignaturing

  1. Creating a new signature for a drive is irreversible
  2. A datastore with extents (Spanned Datastore) may only be resignatured if all extents are online
  3. The VMs that use a datastore that was resignatured must be reassociated with the disk in their respective configuration files. The VMs must also be re-registered within vCenter
  4. The procedure is fault tolerant. If interrupted, it will continue later

Resignature a datastore using vSphere Client

  1. Log into vCenter using vClient
  2. Click Configuration > Storage
  3. Click Add Storage in the right window frame
  4. Select Disk/LUN and click Next
  5. Select the device to add and click Next
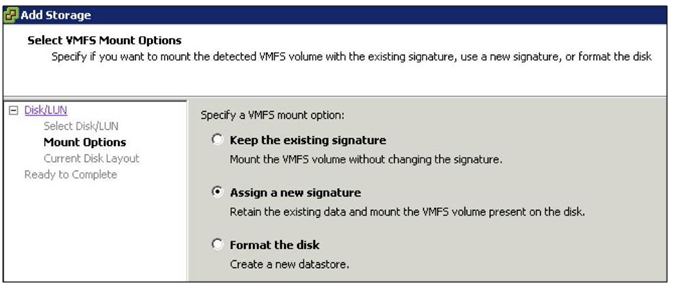
  6. You then have 3 options

sig

  1. Keep the existing signature: This option will leave the VMFS partition unchanged
  2. Assign a new signature: This option will delete the existing disk signature and replace it with a new one. This option must be selected if the original VMFS volume is still mounted (It isn’t possible to have two separate volumes with the same UUID mounted simultaneously)
  3. Format the disk: This option is the same as creating a new VMFS volume on an empty LUN
  4. Select Assign new signature and click Next
  5. Review your changes and then click Finish

Applying resignaturing using ESXCLI

  • SSH into a host using Putty or login into vMA
  • Type esxcli storage vmfs snapshot list. This will list the copies
  • esxcli storage vmfs snapshot mount -l (VolumeName)
  • esxcli storage vmfs snapshot resignature -l (VolumeName)

Troubleshooting

As of ESXi/ESX 4.0, it is no longer necessary to handle snapshot LUNs via the CLI. Resignature and Force-Mount operations have full GUI support and vCenter Server does VMFS rescans on all hosts after a resignature operation.

Snapshot LUNs issue is caused when the ESXi/ESX host cannot confirm the identity of the LUN with what it expects to see in the VMFS metadata. This can be caused by replaced SAN hardware, firmware upgrades, SAN replication, DR tests, and some HBA firmware upgrades. Some ESXi/ESX host upgrades from 3.5 to 4.x (due to the change in naming convention from mpx to naa) have also been known to cause this, but this is a rare occurrence. For more/related information, see Managing Duplicate VMFS Datastores in the vSphere Storage Guide for ESXi 5.x.

Force mounting a VMFS datastore may fail if:

  1. Multiple ESXi/ESX 4.x and 5.0 hosts are managed by the same vCenter Server and these hosts are in the same datacenter.
  2. A snapshot LUN containing a VMFS datastore is presented to all these ESXi/ESX hosts.
  3. One of these ESXi/ESX hosts has force mounted the VMFS datastore that resides on this snapshot LUN.
  4. A second ESXi/ESX host is attempting to do an operation at the same time.

When one ESXi/ESX host force mounts a VMFS datastore residing on a LUN which has been detected as a snapshot, an object is added to the datacenter grouping in the vCenter Server database to represent that datastore.

When a second ESXi/ESX host attempts to do the same operation on the same VMFS datastore, the operation fails because an object already exists within the same datacenter grouping in the vCenter Server database.

Since an object already exists, vCenter Server does not allow mounting the datastore on any other ESXi/ESX host residing in that same datacenter.

ESXCLI Commands for troubleshooting

Snapshot1

Useful YouTube Link

http://www.youtube.com/watch?feature=player_embedded&v=CFJTjbPGlY4

VMware Article Link

http://kb.vmware.com/selfservice/microsites/search.do?language=en_US&cmd=displayKC&externalId=1011387

Apply VMware storage Best Practices

best-practice

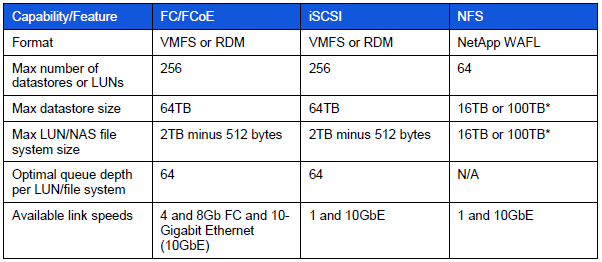
Datastore supported features

ds

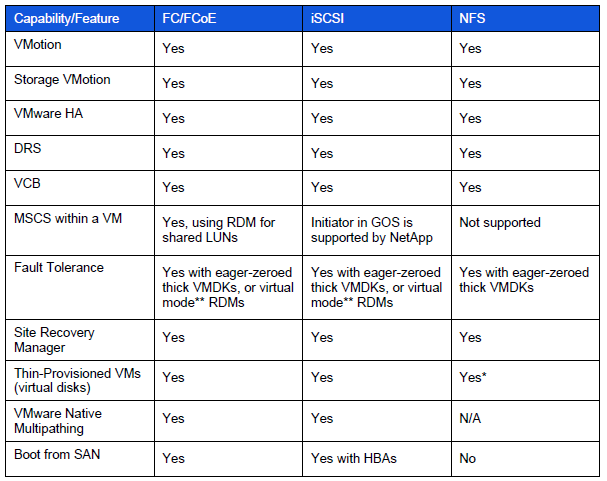
VMware supported storage related functionality

ds3

Storage Best Practices

  • Always use the Vendors recommendations whether it be EMC, NetApp or HP etc
  • Document all configurations
  • In a well-planned virtual infrastructure implementation, a descriptive naming convention aids in identification and mapping through the multiple layers of virtualization from storage to the virtual machines. A simple and efficient naming convention also facilitates configuration of replication and disaster recovery processes.
  • Make sure your SAN fabric is redundant (Multi Path I/O)
  • Separate networks for storage array management and storage I/O. This concept applies to all storage protocols but is very pertinent to Ethernet-based deployments (NFS, iSCSI, FCoE). The separation can be physical (subnets) or logical (VLANs), but must exist.
  • If leveraging an IP-based storage protocol I/O (NFS or iSCSI), you might require more than a single IP address for the storage target. The determination is based on the capabilities of your networking hardware.
  • With IP-based storage protocols (NFS and iSCSI) you channel multiple Ethernet ports together. NetApp refers to this function as a VIF. It is recommended that you create LACP VIFs over multimode VIFs whenever possible.
  • Use CAT 6 cabling rather than CAT 5
  • Enable Flow-Control (should be set to receive on switches and
    transmit on iSCSI targets)
  • Enable spanning tree protocol with either RSTP or portfast
    enabled. Spanning Tree Protocol (STP) is a network protocol that makes sure of a loop-free topology for any bridged LAN
  • Configure jumbo frames end-to-end. 9000 rather than 1500 MTU
  • Ensure Ethernet switches have the proper amount of port
    buffers and other internals to support iSCSI and NFS traffic
    optimally
  • Use Link Aggregation for NFS
  • Maximum of 2 TCP sessions per Datastore for NFS (1 Control Session and 1 Data Session)
  • Ensure that each HBA is zoned correctly to both SPs if using FC
  • Create RAID LUNs according to the Applications vendors recommendation
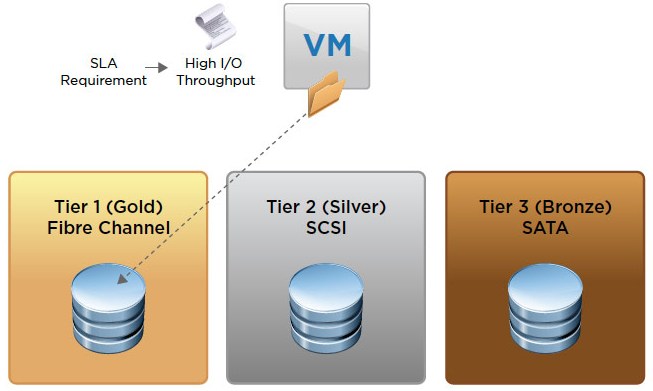
  • Use Tiered storage to separate High Performance VMs from Lower performing VMs
  • Choose Virtual Disk formats as required. Eager Zeroed, Thick and Thin etc
  • Choose RDMs or VMFS formatted Datastores dependent on supportability and Aplication vendor and virtualisation vendor recommendation
  • Utilise VAAI (vStorage APIs for Array Integration) Supported by vSphere 5
  • No more than 15 VMs per Datastore
  • Extents are not generally recommended
  • Use De-duplication if you have the option. This will manage storage and maintain one copy of a file on the system
  • Choose the fastest storage ethernet or FC adaptor (Dependent on cost/budget etc)
  • Enable Storage I/O Control
  • VMware highly recommend that customers implement “single-initiator, multiple storage target” zones. This design offers an ideal balance of simplicity and availability with FC and FCoE deployments.
  • Whenever possible, it is recommended that you configure storage networks as a single network that does not route. This model helps to make sure of performance and provides a layer of data security.
  • Each VM creates a swap or pagefile that is typically 1.5 to 2 times the size of the amount of memory configured for each VM. Because this data is transient in nature, we can save a fair amount of storage and/or bandwidth capacity by removing this data from the datastore, which contains the production data. In order to accomplish this design, the VM’s swap or pagefile must be relocated to a second virtual disk stored in a separate datastore
  • It is the recommendation of NetApp, VMware, other storage vendors, and VMware partners that the partitions of VMs and the partitions of VMFS datastores are to be aligned to the blocks of the underlying storage array. You can find more information around VMFS and GOS file system alignment in the following documents from various vendors
  • Failure to align the file systems results in a significant increase in storage array I/O in order to meet the I/O requirements of the hosted VMs

vCenter Server Storage Filters

filter_data

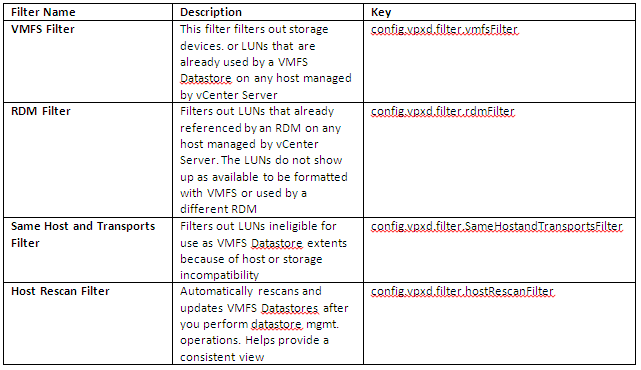
What are the vCenter Server Storage Filters?

They are filters provided by vCenter to help avoid device corruption or performance issues which could arise as a result of using an unsupported storage device.

Storage Filter Chart

filter

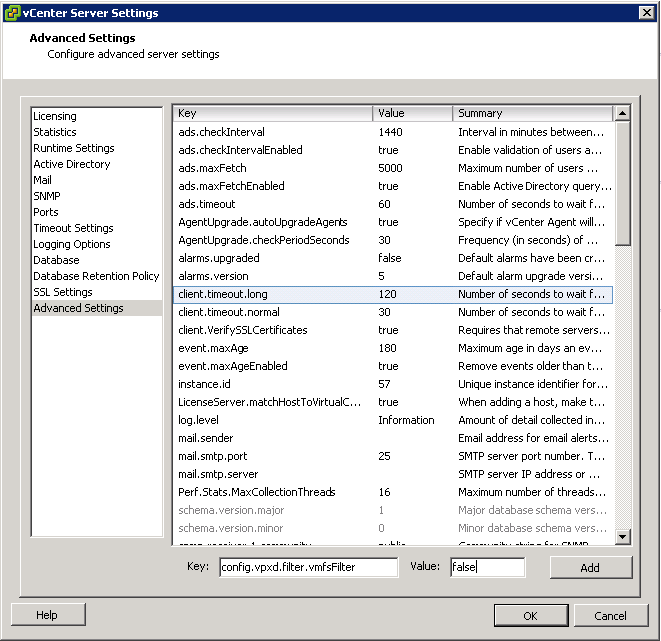
How to access the Storage Filters

If you want to change the filter behaviour, please do the following

  • Log into the vSphere client
  • Select Administration > vCenter Server Settings
  • Select Advanced Settings
  • In the Key box, type the key you want to change
  • To disable the key, type False
  • Click Add
  • Click OK
  • Note the pic below is from vSphere 4.1

advsettings

Determine appropriate RAID levels for various Virtual Machine workloads

storage

Choosing a RAID level for a particular machine workload relies on the consideration of a lot of different factors if you want your machine/machines to run at their maximum potential and with Best Practices in mind

Other factors

  • Manufacturers Disk IOPs values
  • Type of Disk. E.g SATA, SAS, NSATA, SSD and FC
  • Speed of Disk. E.g 15K or 10K RPM etc
  • To ensure a stable and consistent I/O response, maximize the number of VM storage disks available. This strategy enables you to spread disk reads and writes across multiple disks at once, which reduces the strain on a smaller number of drives and allows for greater throughput and response times.
  • Controller and transport speeds affect VM performance
  • Disk Cost.
  • Some vendors have their own proprietary RAID Level. E.g Netapp RAID DP
  • The RAID level you choose for your LUN configuration can further optimize VM performance. But there’s a cost-vs-functionality component to consider. RAID 0+1 and 1+0 will give you the best virtual machine performance but will come at a higher cost, because they utilize only  50% of all allocated disks
  • RAID 5 will give you more storage for your money, but it requires you to write parity bits across drives. However slower SANs or local VM storage can create a resource deficit which can create bottlenecks
  • Cache Sizes
  • Connectivity. E.g. ISCSI, FC or FCOE. Fibre Channel and iSCSI are the most common transports and within these transports, there are different speeds. E.g. 1/10 GB iSCSI and 4/8 GB FC
  • Thin provisioning. This will take up less space on the SAN but create extra I/O utilisation due to the zeroing of blocks on write
  • De-deuplication. This does not necessarily improve storage performance but it stops duplicate data on storage which can save a great deal of money
  • Predictive Scheme. Create several LUNs with varying storage characteristics
  • Adaptive Scheme. Create large datastores and place VMs on and monitor performance

Please see the following links for general information on RAID and IOPS

http://www.electricmonk.org.uk/2013/01/03/raid-levels/

http://www.electricmonk.org.uk/2012/01/30/iops/


Group Policy Loopback Processing

3d key

Group Policy Processing

Group Policy Objects (GPO) are a collection of configurable policy settings that are organised as a single object and contain Computer Configuration policies which are applied to computers during Startup and User Configuration policies which are applied to users during logon.

Group Policy has 2 main configurations

  • Computer
  • User

When the computer starts, it processes all of the computer policies that are assigned to the computer object from AD in this order:

  • Local Policy
  • Site
  • Domain
  • OU
  • Child OU
  • Any startup scripts that were assigned to it in Group Policy

When a user logs in to the computer, the computer processes all of the policies assigned to that user object in this order:

  • Local Policy
  • Site
  • Domain
  • OU
  • Child OU
  • Any startup scripts that were assigned to it in Group Policy

What is Loopback processing?

The User Group Policy loopback processing mode option available within the computer configuration node of a Group Policy Object is a useful tool for ensuring certain user settings are applied on specified computers.

Essentially loopback processing changes the standard group policy processing in a way that allows user configuration settings to be applied based on the computers GPO scope during logon. This means that user configuration options can be applied to all users who log on to a specific computer.

Where is Loopback Processing found?

Loopback processing is configured in the Group Policy Management Console in Computer Configuration / Policies / Administrative Templates / System / Group Policy / User Group Policy loopback processing mode.

Modes

  • Replace

Replace Mode replaces the User policy that is assigned to the user. In the Computer Configuration, set the loopback processing mode to Replace. Next, assign user policies to the computer in addition to the computer polices, you would normally assign. When the computer starts, it will process the computer policies. When the user logs in, instead of processing the GPO’s assigned to the user, the computer will apply the user policies that are assigned to the computer object.

Where can it be used?

  • File, Print, and other servers that non-admin users don’t typically access via the console or Remote Desktop. When someone with admin rights logs in via the console or Remote Desktop, they only have the default policy or any other policy
  • Redirecting folders, mapping printers, or assigning software with Group Policy; you don’t want unwanted drivers or software showing up on your production server that now has to be maintained or removed.
  • Kiosk systems. An Administrator would typically have an unrestricted desktop experience. If that user logs onto a Kiosk machine, he or she would normally have a “wide open” desktop. This might be dangerous, so it may be useful to enable Replace mode to enforce a specific set of enforced settings.
  • Any other environment where the user settings should be determined by the computer account instead of the user account.
  • Terminal Servers

loopback

  • Merge

Merge Mode combines the policy that is assigned to the user instead of completely replacing it like in Replace Mode. When the computer starts, it will process the assigned computer policies. When the user logs in, the computer will process the user policies assigned to the user as it normally would and then processes the user policies that have been assigned to the computer object.

merge

Where can it be used?

  • Merge Mode can be useful if you need to make additions to a policy or override a general user policy that a user receives when he/she logs in to a computer

Processing order of Loopback Mode

Without Loopback

  • Computer Node policies from all GPOs in scope for the computer account object are applied during start-up (in the normal Local, Site, Domain, OU order)
  • User Node policies from all GPOs in scope for the user account object are applied during logon (in the normal Local, Site, Domain, OU order).

Loopback processing enabled (Merge Mode)

  • Computer Node policies from all GPOs in scope for the computer account object are applied during start-up (in the normal Local, Site, Domain, OU order), the computer flags that loopback processing (Merge Mode) is enabled.
  • User Node policies from all GPOs in scope for the user account object are applied during logon (in the normal Local, Site, Domain, OU order).
  • As the computer is running in loopback (Merge Mode) it then applies all User Node policies from all GPOs in scope for the computer account object during logon (Local, Site, Domain and OU),
  • If any of these settings conflict with what was applied , then the computer account setting will take precedence.

Loopback processing enabled (Replace Mode)

  • Computer Node policies from all GPOs in scope for the computer account object are applied during start-up (in the normal Local, Site, Domain, OU order), the computer flags that loopback processing (Replace Mode) is enabled.
  • User Node policies from all GPOs in scope for the user account object are not applied during logon (as the computer is running loopback processing in Replace mode no list of user GPOs has been collected).
  • As the computer is running in loopback (Replace Mode) it then applies all User Node policies from all GPOs in scope for the computer account object during logon (Local, Site, Domain and OU)

Useful Link

http://kudratsapaev.blogspot.co.uk/2009/07/loopback-processing-of-group-policy.html