CPU
A short spike in CPU usage indicates that you are making the best use of the host resources. However, if the value is constantly high, the host is probably lacking the CPU required to meet the demand. A high CPU usage value can lead to increased ready time and processor queuing of the virtual machines on the host.
If the CPU usage value for a virtual machine is above 90% and the CPU ready value is above 20%, performance is being impacted.
If performance is impacted, consider taking the actions listed below
Actions
- Verify that VMware Tools is installed on every virtual machine on the host.
- Set the CPU reservations for all high-priority virtual machines to guarantee that they receive the CPU cycles required.
- Reduce the number of virtual CPUs on a virtual machine to only the number required to execute the workload. For example, a single-threaded application on a four-way virtual machine only benefits from a single vCPU. But the hypervisor’s maintenance of the three idle vCPUs takes CPU cycles that could be used for other work.
- If the host is not already in a DRS cluster, add it to one. If the host is in a DRS cluster, increase the number of hosts and migrate one or more virtual machines onto the new host.
- Upgrade the physical CPUs or cores on the host if necessary
- Use the newest version of ESX/ESXi, and enable CPU-saving features such as TCP Segmentation Offload, large memory pages, and jumbo frames.
Memory
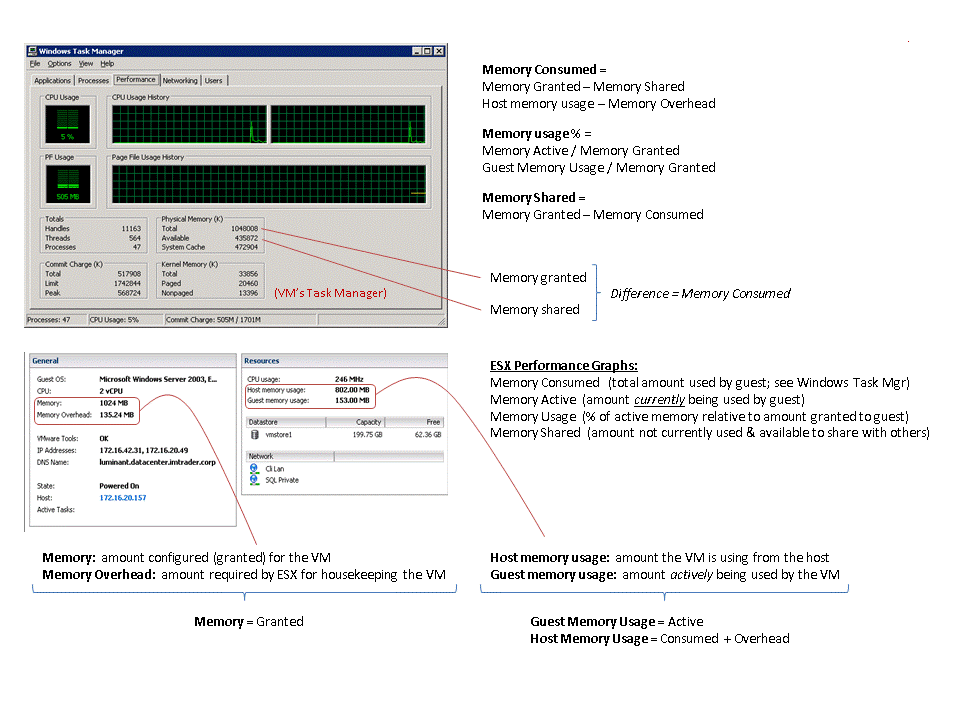
To ensure best performance, the host memory must be large enough to accommodate the active memory of the virtual machines. Note that the active memory can be smaller than the virtual machine memory size. This allows you to over-provision memory, but still ensures that the virtual machine active memory is smaller than the host memory.
Transient high-usage values usually do not cause performance degradation. For example, memory usage can be high when several virtual machines are started at the same time or when there is a spike in virtual machine workload. However, a consistently high memory usage value (94% or greater) indicates that the host is probably lacking the memory required to meet the demand. If the active memory size is the same as the granted memory size, demand for memory is greater than the memory resources available. If the active memory is consistently low, the memory size might be too large.
If the memory usage value is high, and the host has high ballooning or swapping, check the amount of free physical memory on the host. A free memory value of 6% or less indicates that the host cannot handle the demand for memory. This leads to memory reclamation which may degrade performance.
If the host has enough free memory, check the resource shares, reservation, and limit settings of the virtual machines and resource pools on the host. Verify that the host settings are adequate and not lower than those set for the virtual machines.
If the host has little free memory available, or if you notice a degredation in performance, consider taking the actions listed
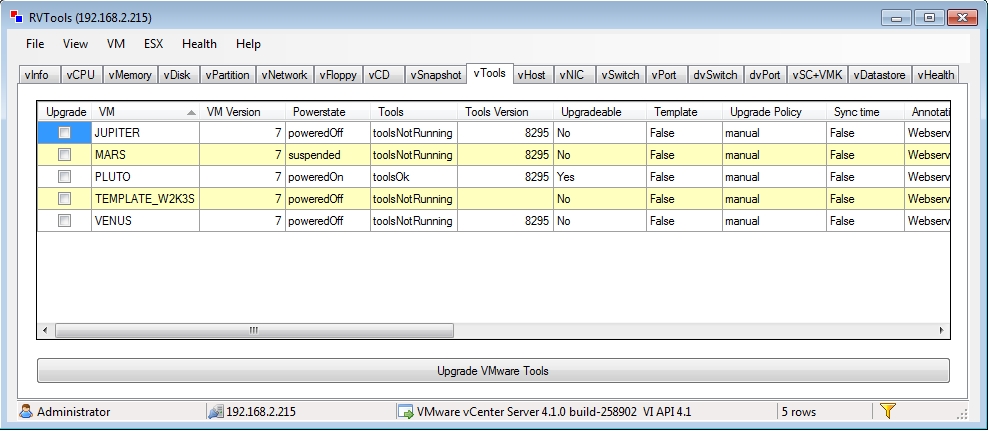
- Verify that VMware Tools is installed on each virtual machine. The balloon driver is installed with VMware Tools and is critical to performance.
- Verify that the balloon driver is enabled. The VMkernel regularly reclaims unused virtual machine memory by ballooning and swapping. Generally, this does not impact virtual machine performance.
- Reduce the memory space on the virtual machine, and correct the cache size if it is too large. This frees up memory for other virtual machines.
- If the memory reservation of the virtual machine is set to a value much higher than its active memory, decrease the reservation setting so that the VMkernel can reclaim the idle memory for other virtual machines on the host.
- Migrate one or more virtual machines to a host in a DRS cluster.
- Add physical memory to the host.
Disk
Use the disk charts to monitor average disk loads and to determine trends in disk usage. For example, you might notice a performance degradation with applications that frequently read from and write to the hard disk. If you see a spike in the number of disk read/write requests, check if any such applications were running at that time.
The best ways to determine if your vSphere environment is experiencing disk problems is to monitor the disk latency data counters. You use the Advanced performance charts to view these statistics.
■ The kernelLatency data counter measures the average amount of time, in milliseconds, that the VMkernel spends processing each SCSI command. For best performance, the value should be 0-1 milliseconds. If the value is greater than 4ms, the virtual machines on the ESX/ESXi host are trying to send more throughput to the storage system than the configuration supports. Check the CPU usage, and increase the queue depth.
■ The deviceLatency data counter measures the average amount of time, in milliseconds, to complete a SCSI command from the physical device. Depending on your hardware, a number greater than 15ms indicates there are probably problems with the storage array. Move the active VMDK to a volume with more spindles or add disks to the LUN.
■ The queueLatency data counter measures the average amount of time taken per SCSI command in the VMkernel queue. This value must always be zero. If not, the workload is too high and the array cannot process the data fast enough.
Actions
- Increase the virtual machine memory. This should allow for more operating system caching, which can reduce I/O activity. Note that this may require you to also increase the host memory. Increasing memory might reduce the need to store data because databases can utilize system memory to cache data and avoid disk access.
To verify that virtual machines have adequate memory, check swap statistics in the guest operating system. Increase the guest memory, but not to an extent that leads to excessive host memory swapping. Install VMware Tools so that memory ballooning can occur. - Defragment the file systems on all guests.
- Disable antivirus on-demand scans on the VMDK and VMEM files.
- Use the vendor’s array tools to determine the array performance statistics. When too many servers simultaneously access common elements on an array, the disks might have trouble keeping up. Consider array-side improvements to increase throughput.
- Use Storage VMotion to migrate I/O-intensive virtual machines across multiple ESX/ESXi hosts
- Balance the disk load across all physical resources available. Spread heavily used storage across LUNs that are accessed by different adapters. Use separate queues for each adapter to improve disk efficiency.
- Configure the HBAs and RAID controllers for optimal use. Verify that the queue depths and cache settings on the RAID controllers are adequate. If not, increase the number of outstanding disk requests for the virtual machine by adjusting the Disk.SchedNumReqOutstanding parameter. For more information, see the Fibre Channel SAN Configuration Guide.
- For resource-intensive virtual machines, separate the virtual machine’s physical disk drive from the drive with the system page file. This alleviates disk spindle contention during periods of high use
- On systems with sizable RAM, disable memory trimming by adding the line MemTrimRate=0 to the virtual machine’s .VMX file.
- If the combined disk I/O is higher than a single HBA capacity, use multipathing or multiple links.
- For ESXi hosts, create virtual disks as preallocated. When you create a virtual disk for a guest operating system, select Allocate all disk space now. The performance degradation associated with reassigning additional disk space does not occur, and the disk is less likely to become fragmented.
- Use the most current ESX/ESXi host hardware.
Networking
Network performance is dependent on application workload and network configuration. Dropped network packets indicate a bottleneck in the network. To determine whether packets are being dropped, use esxtop or the advanced performance charts to examine the droppedTx and droppedRx network counter values.
If packets are being dropped, adjust the virtual machine shares. If packets are not being dropped, check the size of the network packets and the data receive and transfer rates. In general, the larger the network packets, the faster the network speed. When the packet size is large, fewer packets are transferred, which reduces the amount of CPU required to process the data. When network packets are small, more packets are transferred but the network speed is slower because more CPU is required to process the data.
If packets are not being dropped and the data receive rate is slow, the host is probably lacking the CPU resources required to handle the load. Check the number of virtual machines assigned to each physical NIC. If necessary, perform load balancing by moving virtual machines to different vSwitches or by adding more NICs to the host. You can also move virtual machines to another host or increase the host CPU or virtual machine CPU.
If you experience network-related performance problems, also consider taking the actions listed below
Actions
- Verify that VMware Tools is installed on each virtual machine.
- If possible, use vmxnet3 NIC drivers, which are available with VMware Tools. They are optimized for high performance.
- If virtual machines running on the same ESX/ESXi host communicate with each other, connect them to the same vSwitch to avoid the cost of transferring packets over the physical network.
- Assign each physical NIC to a port group and a vSwitch.
- Use separate physical NICs to handle the different traffic streams, such as network packets generated by virtual machines, iSCSI protocols, VMotion tasks, and service console activities.
- Ensure that the physical NIC capacity is large enough to handle the network traffic on that vSwitch. If the capacity is not enough, consider using a high-bandwidth physical NIC (10Gbps) or moving some virtual machines to a vSwitch with a lighter load or to a new vSwitch.
- If packets are being dropped at the vSwitch port, increase the virtual network driver ring buffers where applicable.
- Verify that the reported speed and duplex settings for the physical NIC match the hardware expectations and that the hardware is configured to run at its maximum capability. For example, verify that NICs with 1Gbps are not reset to 100Mbps because they are connected to an older switch.
- Verify that all NICs are running in full duplex mode. Hardware connectivity issues might result in a NIC resetting itself to a lower speed or half duplex mode.
- Use vNICs that are TSO-capable, and verify that TSO-Jumbo Frames are enabled where possible


