Archive for Performance

Key Windows Performance Counters, Info and Limits

Key Windows Performance Counters, Info and Limits

Counter

Description

What to watch for

Logical Disk\% Free Space Measures the percentage of free space of the selected Logical Disk If it is below 15% then you run the risk of running out of space to store critical O/S files
PhysicalDisk\Idle Time Measures the percentage of time the disk was idle during the sample interval If this value falls below 20% the disk system is said to be saturated and you should install a faster disk system
PhysicalDisk\Avg. Disk Sec/Read Measures the average time in seconds to read data from the disk If this value is larger than 25 milliseconds the disk system is experiencing latencyFor SQL and Exchange the threshold is lower – 10ms
PhysicalDisk\Avg. Disk Sec/Write Measures the average time in seconds to write data from the disk If this value is larger than 25 milliseconds the disk system is experiencing latencyFor SQL and Exchange the threshold is lower – 10ms
Physical Disk\Avg Queue Length How many I/O Operations are waiting for the Hard Drive to become available If the value of the counter is larger than twice the number of disk spindles in an array then the disk may be a bottleneck
Memory\Cache Bytes Indicates the amount of memory being used for the file system cache. There will be a bottleneck if the value is greater than 300MB
Processor\%Idle Time % Idle Time is the percentage of time the processor is idle during the sample interval Below 20% and you are running at CPU saturation if this prolonged
Processor\Interrupts/sec The numbers of interrupts the processor was asked to respond to. Interrupts are generated from hardware components like hard disk controller adapters and network interface cards. A sustained value over 1000 is usually an indication of a problem. Problems would include a poorly configured drivers, errors in drivers, excessive utilization of a device (like a NIC on an IIS server), or hardware failure
Processor\%Processor Time Measures  how much time the processor actually spends working on productive threads and how often it was busy servicing requests. It actually provides a measurement of how often the system is doing nothing subtracted from 100%. This is a simpler calculation for the processor to make. The processor can never be sitting idle waiting to the next task, unlike our cashier. The CPU must always have something to do. It’s like when you turn on the computer, the CPU is a piece of wire that electric current is always running through, thus it must always be doing something. NT give the CPU something to do when there is nothing else waiting in the queue. This is called the idle thread. The system can easily measure how often the idle thread is running as opposed to having to tally the run time of each of the other process threads. Then , the counter simply subtracts the percentage from 100%. This counter is a natural choice that will give use the amount of time that this particular process spends using the processor resource.
Memory\Page Faults/sec This counter gives a general idea of how many times information being requested is not where the application (and VMM) expects it to be. The information must either be retrieved from another location in memory or from the pagefile. While a sustained value may indicate trouble here, you should be more concerned with hard page faults that represent actual reads or writes to the disk. Remember that the disk access is much slower than RAM
Memory\%Committed Bytes in use This counter indicates the total amount of memory that has been committed for the exclusive use of any of the services or processes on Windows NT. Should this value approach the committed limit, you will be facing a memory shortage of unknown cause, but of certain severe consequence.
Memory\Available Bytes This counter indicates the amount of memory that is left after nonpaged pool allocations, paged pool allocations, process’ working sets, and the file system cache have all taken their piece.
System\System Calls/sec This counter is a measure of the number of calls made to the system components, Kernel mode services. This is a measure of how busy the system is taking care of applications and services—software stuff. When compared to the Interrupts/Sec it will give you an indication of whether processor issues are hardware or software related. See Processor : Interrupts/Sec for more information
System\Threads Threads is the number of threads in the computer at the time of data collection. This is an instantaneous count, not an average over the time interval.  A thread is the basic executable entity that can execute instructions in a processor. Monitor loosely
System\Processor Queue Length Gives an indication of how many threads are waiting for execution. If this counter is consistently higher than around 5 when processor utilization approaches 100%, then this is a good indication that there is more work (active threads) available (ready for execution) than the machine’s processors are able to handle. Note that this is not always a hard and fast indicator however, for some services like IIS 6 pool and manage their own worker threads, so on a busy web server for example you would want to look at other counters like ASP\Requests Queued or ASP.NET\Requests Queued as well. Furthermore, the larger the number of active services and applications running on your server, the busier the processor queue will normally be, so on a multi-role server running near 100% utilization content may only be a significant factor once System\Processor Queue Length exceeds something like 10 instead of 5 as mentioned previously.
Network Interface : Bytes Sent/sec This is how many bytes of data are sent to the NIC. This is a raw measure of throughput for the network interface. We are really measuring the information sent to the interface which is the lowest point we can measure. If you have multiple NIC, you will see multiple instances of this particular counter. Dependent on NIC Speed
Network Interface: Bytes Received/sec. This, of course, is how many bytes you get from the NIC. This is a measure of the inbound traffic In measuring the bytes, NT isn’t too particular at this level. So, no matter what the byte is, it is counted. This will include the framing bytes as opposed to just the data Dependent on NIC Speed


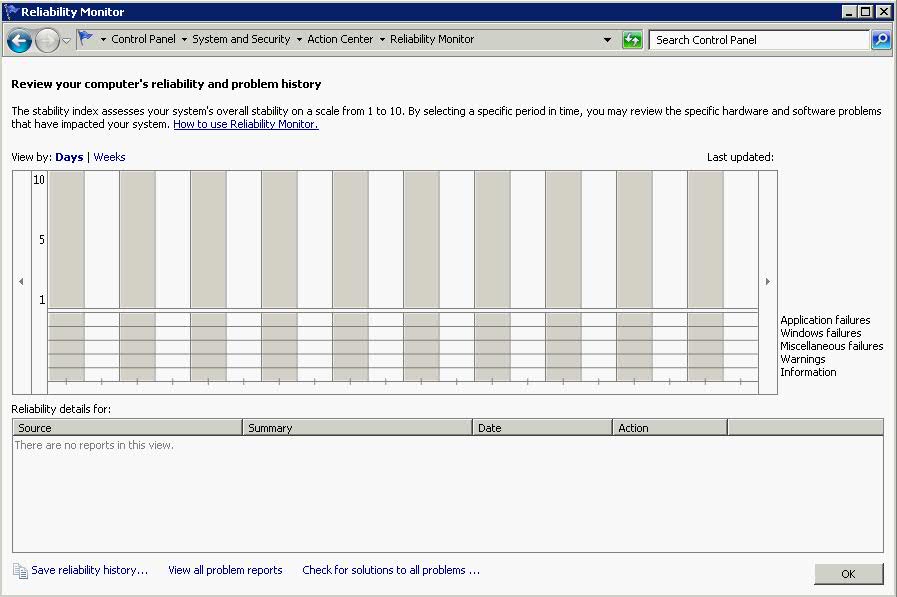
Reliability Monitor in Windows 2008

Reliability Monitor is an advanced tool which measures hardware and software problems and changes to the computer. It provides a stability index which ranges from 1 (Least Stable) to 10 (Most Stable)

Accessing Reliability Monitor

You can access it 2 ways.Either by typing in perfmon/rel or following the steps below

  • Open Action Center
  • Click Maintenance
  • Then under Check for Solutions to Problem Reports, click View Reliability History

What can you do?

  • Click on any event on the graph to view details
  • Click Days or Weeks to view the stability index
  • Click items in the Action Pane to view more info about it
  • Click View All Problem Reports to view only the problems that have occurred on your computer

Gathering System Stability Data

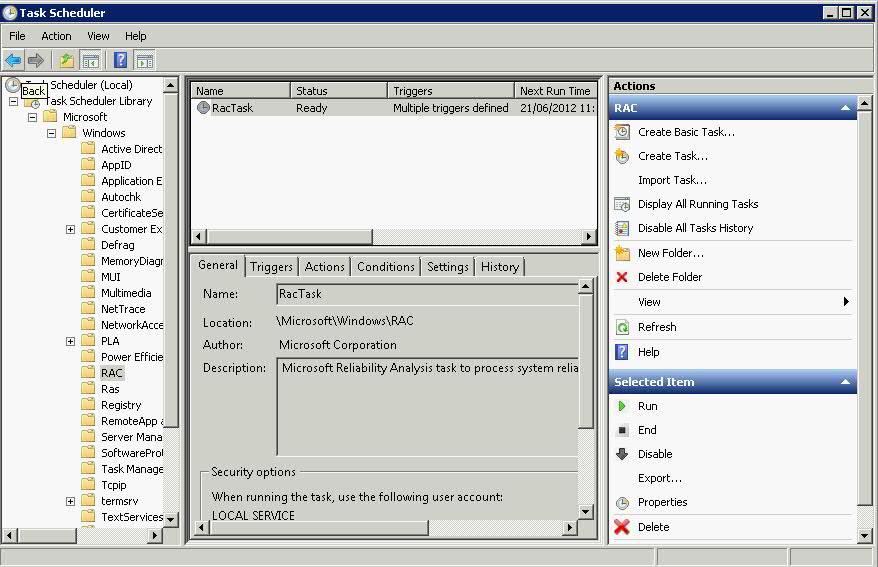
The Reliability Monitor displays data gathered by the Reliability Analysis Component (RAC) This is implemented using RACAgent.exe which is scheduled to run once an hour. Reliability Monitor starts displaying a system stability index rating and specific event information 24 hours after system installation, and the RACAgent task runs by default after that O/S is installed. If it has been disabled, it must be manually enabled from the Task Scheduler snap-in for the MMC.

Enable RACAgent

To enable to RACAgent Task, you must use an account which is a member of the Local Administrators Group on the computer.

  • Click Start > Search > Type taskschd.msc
  • Expand Task Scheduler Library
  • Expand Microsoft
  • Expand Windows
  • Select RAC
  • Right click RAC and select View and Show Hidden Tasks
  • In the Results Pane, right click RACAgent and select Enable

Performance and Resource Monitoring in Windows Server 2008

What does Windows Reliability and Performance Monitor do?

Windows Reliability and Performance Monitor is a Microsoft Management Console (MMC) snap-in that combines the functionality of previous stand-alone tools including Performance Logs and Alerts, Server Performance Advisor, and System Monitor. It provides a graphical interface for customizing performance data collection and Event Trace Sessions.

It also includes Reliability Monitor, an MMC snap-in that tracks changes to the system and compares them to changes in system stability, providing a graphical view of their relationship

What new functionality does this feature provide?

Features of Windows Reliability and Performance Monitor new to Windows Server 2008 include the following.

Data Collector Sets

An important new feature in Windows Reliability and Performance Monitor is the Data Collector Set, which groups data collectors into reusable elements for use with different performance monitoring scenarios. Once a group of data collectors are stored as a Data Collector Set, operations such as scheduling can be applied to the entire set through a single property change.

Windows Reliability and Performance Monitor also includes default Data Collector Set templates to help system administrators begin collecting performance data specific to a Server Role or monitoring scenario immediately.

Wizards and templates for creating logs

Adding counters to log files and scheduling their start, stop, and duration can now be performed through a Wizard interface. In addition, saving this configuration as a template allows system administrators to collect the same log on subsequent computers without repeating the data collector selection and scheduling processes. Performance Logs and Alerts features have been incorporated into the Windows Reliability and Performance Monitor for use with any Data Collector Set.

Resource View

The home page of Windows Reliability and Performance Monitor is the new Resource View screen, which provides a real-time graphical overview of CPU, disk, network, and memory usage. By expanding each of these monitored elements, system administrators can identify which processes are using which resources. In previous versions of Windows, this real-time process-specific data was only available in limited form in Task Manager.

Reliability Monitor

Reliability Monitor calculates a System Stability Index that reflects whether unexpected problems reduced the reliability of the system. A graph of the Stability Index over time quickly identifies dates when problems began to occur. The accompanying System Stability Report provides details to help troubleshoot the root cause of reduced reliability. By viewing changes to the system (installation or removal of applications, updates to the operating system, or addition or modification of drivers) side by side with failures (application failures, operating system crashes, or hardware failures), a strategy for addressing the issues can be developed quickly.

Unified property configuration for all data collection, including scheduling

Whether creating a Data Collector Set for one time use or to log activity on an ongoing basis, the interface for creation, scheduling, and modification is the same. If a Data Collector Set proves to be useful for future performance monitoring, it does not need to be re-created. It can be reconfigured or copied as a template.

User-friendly diagnosis reports

Users of Server Performance Advisor in Windows Server 2003 can now find the same kinds of diagnosis reports in Windows Reliability and Performance Monitor in Windows Server 2008. Report generation time is improved and reports can be created from data collected by using any Data Collector Set. This allows system administrators to repeat reports and assess how changes have affected performance or the report’s recommendations.

Accessing Performance Monitor

Membership in the local Performance Log Users group, or equivalent, is the minimum required to complete this procedure.

To start Performance Monitor

  • Click Start, click in the Start Search box, type perfmon, and press ENTER.
  • In the navigation tree, expand Monitoring Tools, and then click Performance Monitor.

You can also use Performance Monitor to view real-time performance data on a remote computer.

Membership in the target computer’s Performance Log Users group, or equivalent, is the minimum required to complete this procedure

To view performance counters from a remote computer, the Performance Logs and Alerts firewall exception must be enabled on the remote computer. In addition, members of the Performance Log Users group must also be members of the Event Log Readers group on the remote computer

Creating Data Collection Sets

A Data Collector Set is the building block of performance monitoring and reporting in Windows Performance Monitor. It organizes multiple data collection points into a single component that can be used to review or log performance. A Data Collector Set can be created and then recorded individually, grouped with other Data Collector Set and incorporated into logs, viewed in Performance Monitor, configured to generate alerts when thresholds are reached, or used by other non-Microsoft applications. It can be associated with rules of scheduling for data collection at specific times. Windows Management Interface (WMI) tasks can be configured to run upon the completion of Data Collector Set collection.

Data Collector Sets can contain the following types of data collectors:

  • Performance counters
  • Event trace data
  • System configuration information (registry key values)

Real Time Example

  • Start Performance Monitor
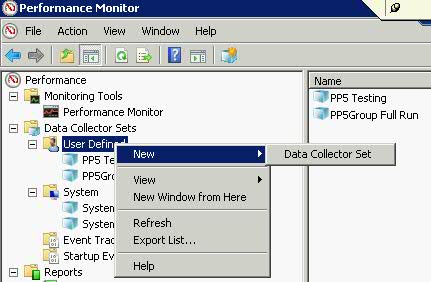
  • Right-click anywhere in the Performance Monitor display pane, point to New, and click Data Collector Set. The Create New Data Collector Set Wizard starts. The Data Collector Set created will contain all of the data collectors selected in the current Performance Monitor view.

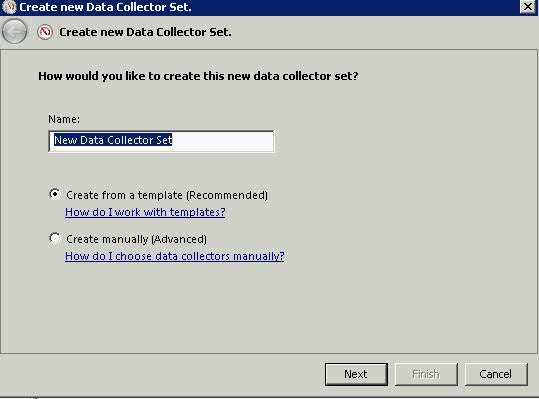
  • Type in a name for your Data Collection Set and Choose from Template

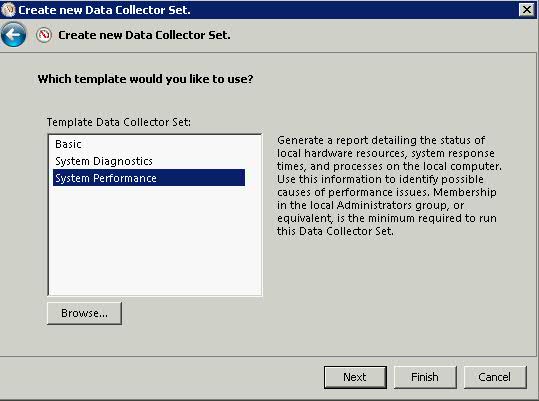
  • Choose a Template (System Performance for this example)

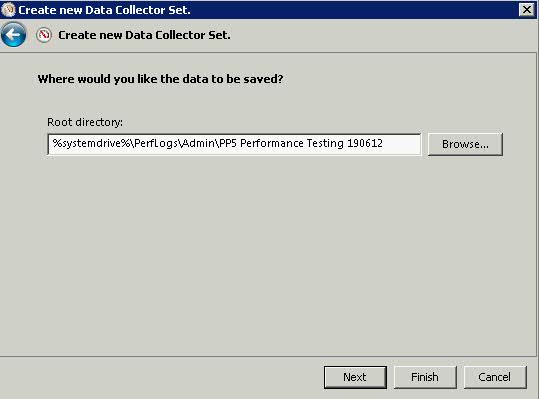
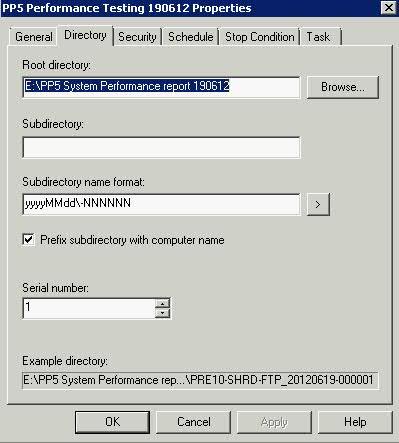
  • Choose where the Data is going to be saved

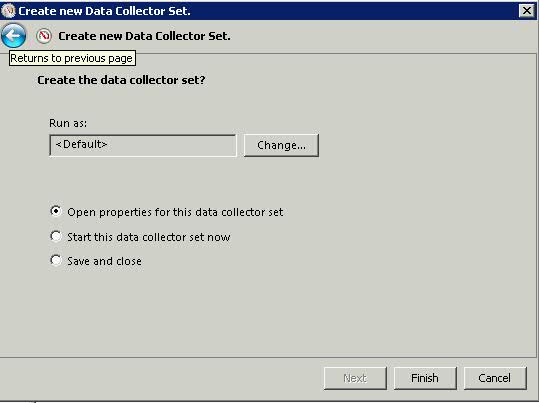
  • Choose who to run this as. If you have permissions then this can be left as default. Choose to open the properties for this job

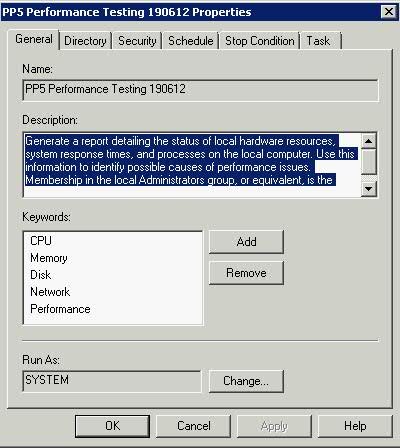
  • The General Tab

  • Click Directory

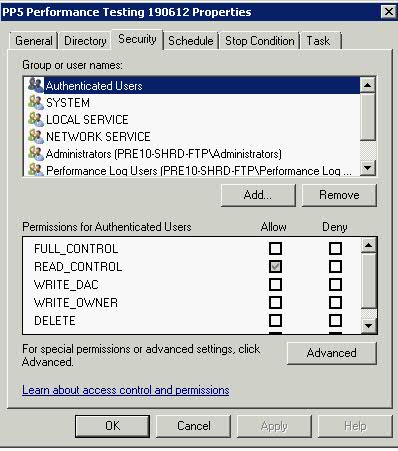
  • Click Security

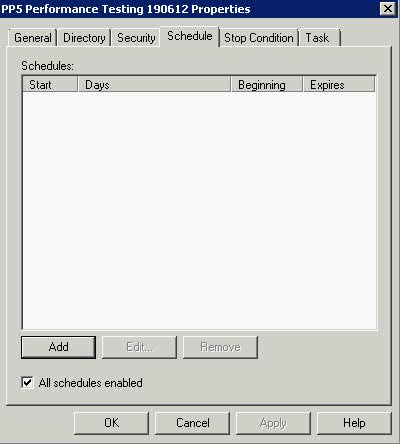
  • Click Schedule

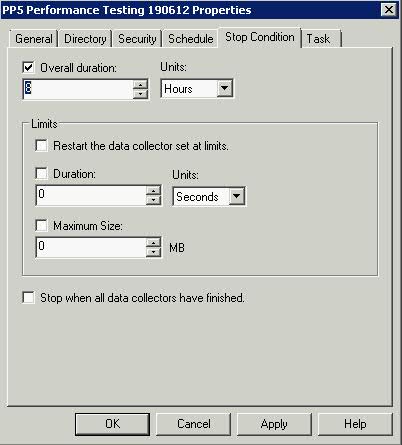
  • Stop Condition

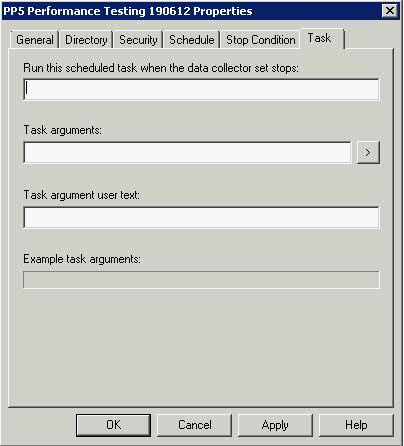
  • Click Task

Reports

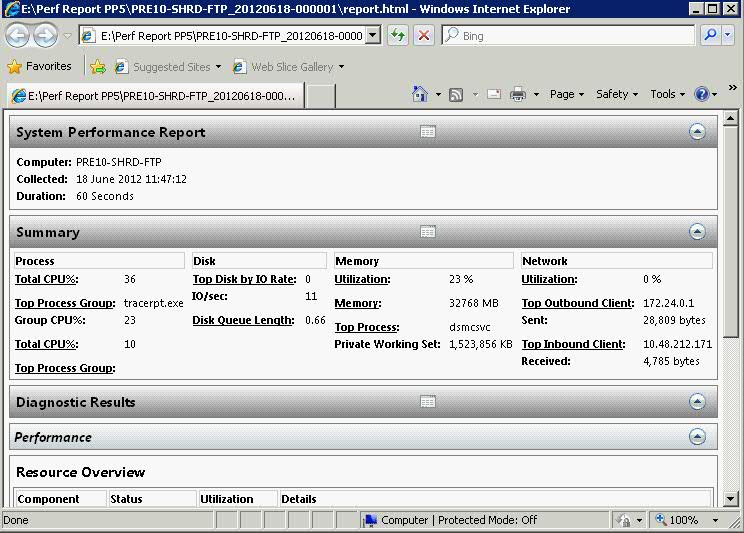
When this job has finished, Performance Monitor will reconcile a report to show the full history of this job.

Analysing the Results

Data Analysis
A tool that Microsoft support relies on to analyze Performance Monitor logs is the Performance Analysis of Logs (PAL) Tool. Clint Huffman, a Microsoft senior premier field engineer, wrote the 6,000-line VBScript tool, which is free and open source. PAL lets administrators easily analyze Performance Monitor logs without requiring them to be experts in performance counters or Windows architecture.

PAL contains a wizard-based UI that asks specific information about the system, which PAL passes as arguments to the VBScript program. PAL picks up where other log analyzers leave off, such as taking into account whether the system is 64-bit or 32-bit, whether the /3GB switch is used, and how much physical memory is installed—all variables that affect system performance. PAL uses these variables along with known thresholds, which were determined by engineers with years of experience, to determine the analysis that’s displayed. PAL provides a chronological order of alerts, so that you can correlate your system’s performance to any problems that you noticed at specific times.

Counters and Limits

http://technet.microsoft.com/en-us/library/cc768048.aspx