Archive for VCAP5 DCA

Identify Logs used to troubleshoot storage issues

images

Logs

Located in var/log

Log

The logs you will want to look at for storage issues are likely to be

  • /var/log/vmkeventd.log

VMkernel deamon related log

  • /var/log/vmkernel.log

Generic NMP messages, iSCSI and fibre channel messages, driver, device discovery, storage and networking devices

  • /var/log/vpxa.log

vCenter Server vpxa agent logs, including communication with vCenter Server and the Host Management hostd agent

  • /var/log/hostd.log

Host management service logs, including virtual  machine and host Task and Events, communication with the vSphere Client  and vCenter Server vpxa agent, and SDK connections

  • /var/log/vmkwarning.log

Generic storage messages, like disconnects. A summary of Warning and Alert log messages excerpted from the VMkernel logs.

  • /var/log/storagerm

If SIOC is enabled then all the logs regarding that will be here

  • vCenter logs

Analyse troubleshooting data to see if the problem lies in the Virtual or the Physical layer

images

Troubleshooting

Troubleshooting can often be frustrating and challenging, and knowing where to look and what to do is the key to quickly finding and resolving problems. You shouldn’t just look through log files when you are experiencing known problems, however. Often, many problems might not be that obvious, and the log files are a good place to look for signs of them happening. You should keep a list of all the log files handy so that you can quickly access them if needed and so not have to waste time when a problem is happening trying to remember their path and filenames. You might not know how to resolve or troubleshoot every problem you encounter, so be sure to rely on the resources available to you, including documentation, support forums, knowledge base, and VMware’s technical support. Being properly prepared to handle problems when they occur is one of the best troubleshooting skills that you can have.

What you can do

  • Check Monitoring Systems if you have them. SCOM, Nagios etc. Some companies have real-time screens showing monitoring
  • Check with your Network Team as they will more than likely be alerted to physical problems faster than you
  • Can you isolate the problem to a VM, Host, Switch or router or is the issue affecting the whole network
  • Ensure that the Port Group name(s) associated with the virtual machine’s network adapter(s) exists in your vSwitch or Virtual Distributed Switch and is/are spelt correctly.
  • Check any warning Triangles or exclamation marks on the standard or distributed switches
  • Verify the virtual network adapter is present and connected for all VMkernel ports
  • Verify that the networking within the virtual machine’s guest operating system is correct
  • Verify that the vSwitch has enough ports for the virtual machine
  • Ensure the physical switch ports are configured as port-channel
  • Shut down all but one of the physical ports the NICs are connected to, and toggle this between all the ports by keeping only one port connected at a time. Take note of the port/NIC combination where the virtual machines lose network connectivity.
  • Check Logs

Configure and Administer Port Mirroring

images

What is Port Mirroring?

Port mirroring is technology that duplicates network packets of a switch port to another port where it is monitored at the destination port. Most switch vendors implement Port Mirroring in their switches. Supported on vDS’s only and overcomes the issue of enabling Promiscuous Mode on a port where this port then sees all the traffic going through it

What is it used for?

  • Troubleshooting
  • Input for network analysis
  • Intrusion Detection systems

Instructions for configuring Port Mirroring

Note: Both source and destination must be on the same ESXi Host

  • Log into vCenter
  • Go to Networking
  • Right click your vDS and select Edit Settings
  • Click the Port Mirroring tab

Mirror1

  • Click Add

Mirror2

  • Put in a name
  • Put in a Description
  • If you do not select Allow normal I/O on destination ports then mirrored traffic is allowed out on destination ports but no traffic is allowed in
  • If you select Encapsulate VLAN then this VLAN ID encapsulates all frames at the destination port. If packets already have a VLAN then the VLAN is replaced with VLAN ID specified here
  • If you select Preserve Original VLAN then the original VLAN is kept and a packet is added with another VLAN tag specified
  • If you select Mirrored Packet Length then this puts a limit on the size of the mirrored frames. Increasing this length increases the time taken to process packets. Used for capturing protocols of a certain length
  • Click Next

Mirror3

  • Traffic direction can be Ingress/Egress or Both

Traffic Direction can be thought of in terms of the vDS. Ingress is traffic from the VM to the vDS and Egress is traffic from the vDS to the VM

  • As an example I chose Port 5 and Ingress/Egress

Mirror4

  • On the destination page you can choose Port or Uplink for a destination and choose more than one of either

There are Caveats

  1. In a session, a port cannot be both a Source and a Destination
  2. A port cannot be a destination for more than one session
  3. A promiscuous port cannot be an Egress source destination
  4. An egress source cannot be a destination of any session to avoid cycles of mirrored paths
  • As an example I have chosen dvUplink 1

Mirroring5

  • Click Enable this Port Mirroring Session. By default it is disabled

Mirroring6

  • Click Finish and check the overview

Mirroring7

Troubleshoot DNS and routing related issues

dns

Using vMA to troubleshoot DNS

dns8

Using Command Line Tools

  • ping
  • netstat
  • ipconfig
  • nslookup
  • ipconfig /flushdns

Using ESXCLI to troubleshoot

  • SSH into the host and run the following commands

DNS11

  • Example below

DNS5

Using the DCUI to check DNS information

  • SSH into a a host
  • Select Configure Management Network
  • Select DNS information to see what the details are

DNS2

  • Press Enter to adjust the config

DNS3

  • You can also check the DNS Suffixes

DNS4

Troubleshoot vmkernel related network configuration issues

LogIcon

Troubleshooting

The following are basic Service Console TCP/IP configuration requirements to check first

  • The ESX host has working physical network adapters connecting to physical network switches appliances
  • Proper/functional Ethernet Cable
  • Gateway appliance that can be either a router or switch appliance is working
  • Establishing method of VLAN Tagging configuration (VST,EST, or VGT)
  • Proper IP address, network sub mask, and gateway configuration
  • Successful pinging of all relevant network addresses associated with the VMKernel
  • You can only have 1 Management Gateway

Checking the Logs

The VMkernel logs can be found in the locations below

vmkernel

Restarting the Management Network

To restart the management network on ESXi:

  1. Connect to the console of your ESXi host.
  2. Press F2 to customize the system.
  3. Login as root
  4. Use the Up/Down arrows to navigate to Restart Management Network

network

  • Click Enter to restart

Using vCLI to troubleshoot the VMkernel

Note: With the release of 5.0, the majority of the legacy esxcfg-*/vicfg-* commands have been migrated over to esxcli. At some point, hopefully not in the distant future, esxcli will be parity complete and the esxcfg-*/vicfg-* commands will be completely deprecated and removed including the esxupdate/vihostupdate utilities.

  • esxcfg-nics
  • vicfg-nics
  • esxcfg-route
  • vicfg-route
  • esxcfg-vmknic
  • vicfg-vmknic
  • esxcfg-vswitch
  • vicfg-vswitch
  • esxcli network nic
  • esxcli network interface
  • esxcli network vswitch
  • esxcli network ip

Using vkernel Commands

Retrieving Network Port Information

vmkernel1

Managing a VMKernel Port

vmkernel2


Identify logs used to troubleshoot network issues

LogIcon

Logs

Methods of accessing logs you need

ESXiLog2

vSphere Logs

The main logs you will need to look at are

  • DHCP issues: /var/log/dhclient.log
  • Network driver/device issues: /var/log/hostd.log & vmkernel.log
  • vCenter issues: /var/log/vpxa.log

ESXILog1


Identify vCenter server performance chart metrics related to Memory and CPU

images

Use the vSphere vCenter Performance Charts to monitor Memory usage and CPU usage of clusters, hosts, virtual machines, and vApps. Really useful statistics in blue

Host Memory

HOST MEM

VM Memory

VM MEM

Host CPU

Host CPU

VM CPU

VM CPU

Analyse Log entries to obtain configuration information and identify and resolve issues

LogIcon

When problems occur in your virtual environment, you need to know where to look for clues to the cause and what to do to resolve them. Often, just trying to figure out the exact cause is the most difficult part, because virtual servers are more complicated than physical servers and there are more potential causes of problems. When you know where to look to find the cause of a problem, the process becomes a lot easier.

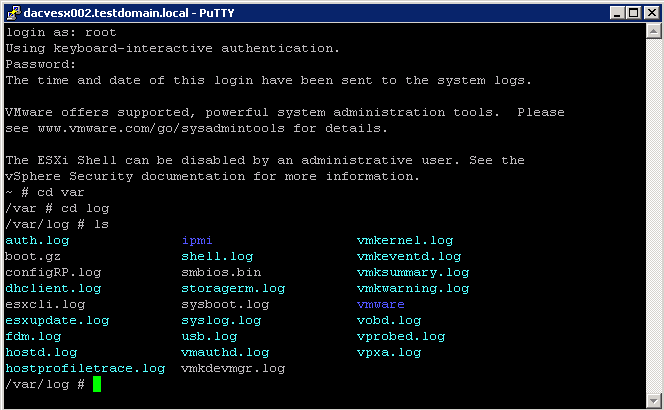
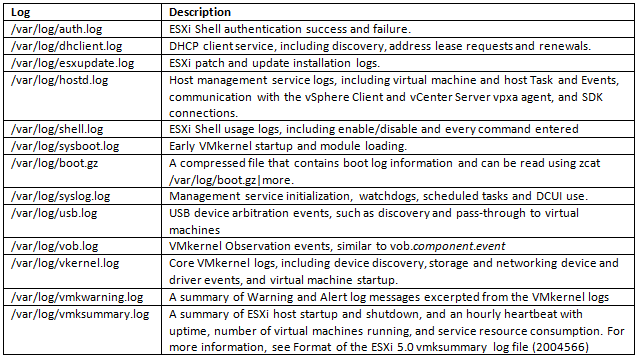
Note: By default, VMware ESXi logs do not persist upon a reboot. If a VMware ESXi host experiences an abrupt reboot due to reasons other than a VMkernel error, the logs do not persist and you do not have access to the logs prior to the reboot to determine the cause

Note: Many logfiles are time stamped using UTC – if you’re host isn’t configured to use UTC this may make correlating events and logs difficult

Types of Searches

The following types of server log entries are generated:

  • Info: Displays basic status information. For example, status information is logged if the server is ready and waiting.
  • Error: Displays errors that occur but do not stop the software from functioning. For example, an error is logged if a user requests secure information that they are not allowed to access.
  • Error Codes: If a KB points you to an error code you can search for this in the logs
  • Fatal: Displays errors that stop the software from functioning. For example, a fatal error is logged if the content server cannot access the database.

How to search through logs

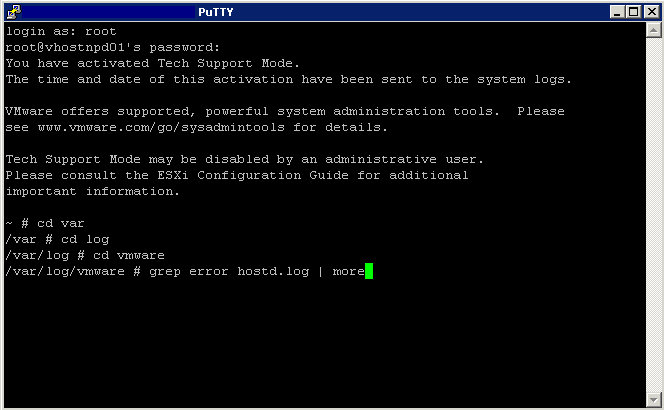
  • You can use the grep command to search for specific terms

grep is a unix command that allows you to search for a pattern in a list of files

logs

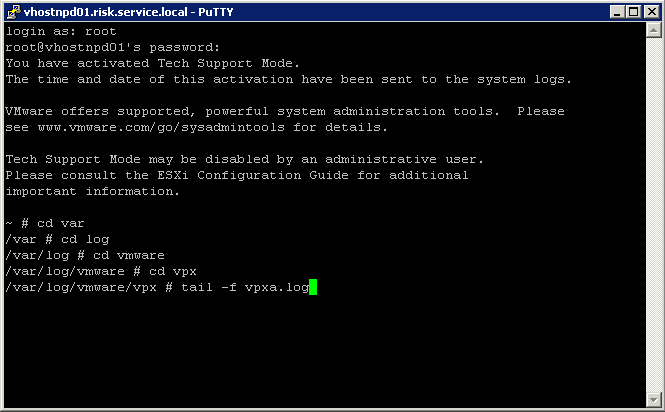
  • You can use tail command tail -f /var/log/hostd.log

Many times you need to view a constantly updating file. This is a common case with logs. People usually think that tail command is only used to view the last parts of a file, but it even provides you with the ability to view growing/changing files.

Please note that, by growing I mean files to whom data is being appended constantly. Using the -f option, tail lets us view the data that is being added to the file in real time.

Logs2

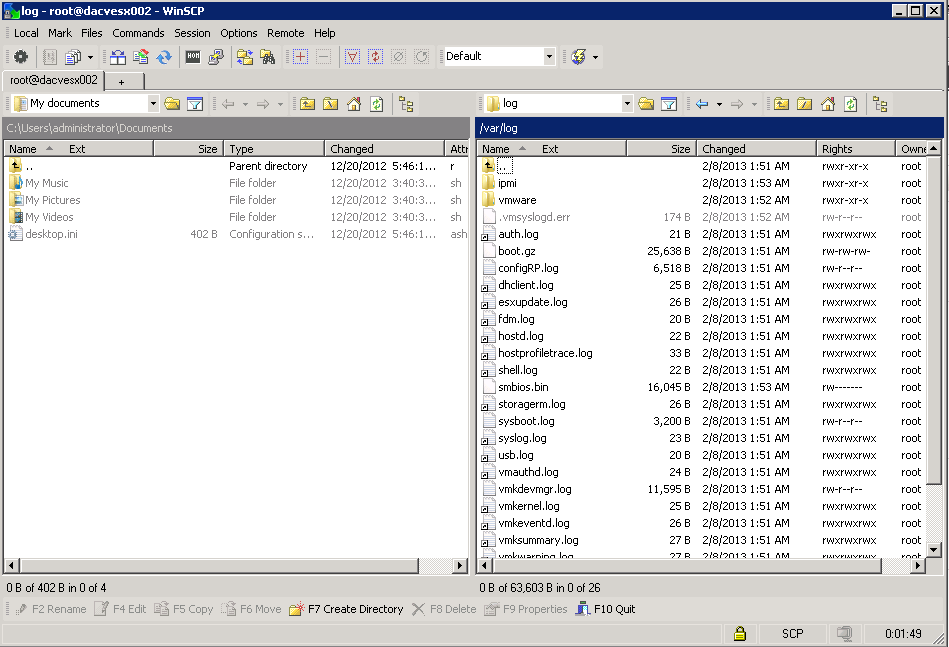
  •  You can use WinSCP to open logs in Notepad and search through them

winscp3

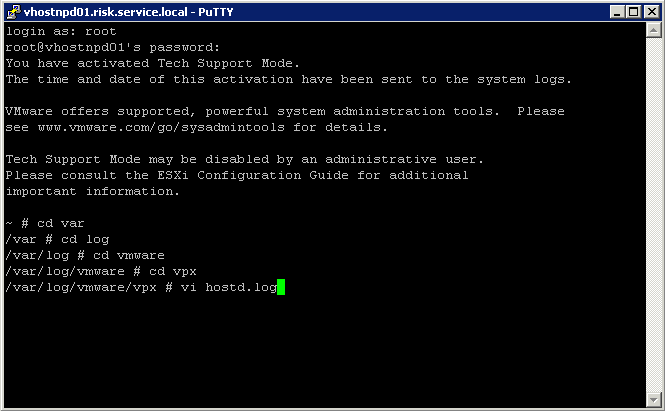
  • Use the built-in text editors to open a log file. You can use nano, which is a bit easier to use, or vi to open a log file. Type nano or vi log file path/name to open one (for example, nano /var/log/vmware/hostd.log).

Logs3

  • There are many 3rd party Tools on the market which will also provide analysis and searching through to find what you need. Examples such as Splunk, XPoLog and vLogView
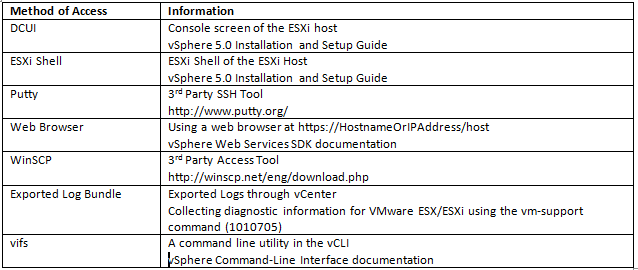
  •  In addition to the methods to view individual log files, you can use the vm-support command (it’s actually a script) that you can run on the ESX Service Console that will bundle together all the log files, configuration files, and output from various commands into a single TGZ file. After the file has been created, you can copy it to your workstation and extract it using the Linux tar command or WinZip

Useful Links

  • VMworld 2009 session VM3325

http://www.vmworld.com/docs/DOC-3765

  • And the most useful document in the world below

http://media.techtarget.com/searchServerVirtualization/downloads/0137008589_CH10.pdf

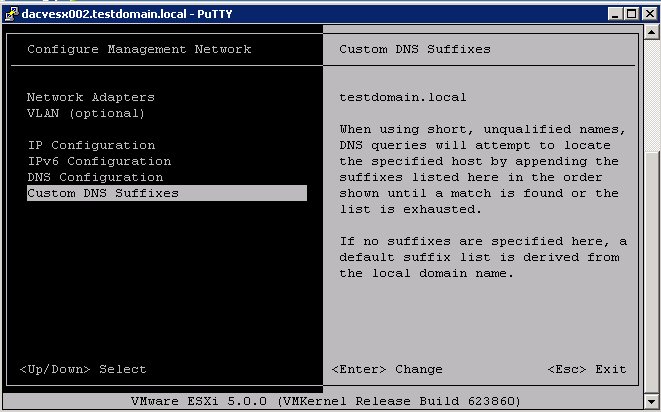
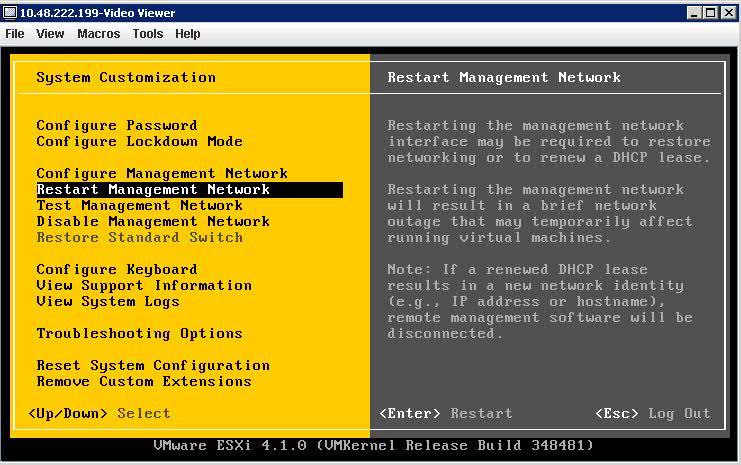
Scrolling through logs using DCUI

http://blogs.vmware.com/vsphere/2012/06/viewing-esxi-logs-from-the-dcui.html

Install and Configure VMware ESXi Dump Collector

dumpicon

What is VMware ESXi Dump Collector?

ESXi hosts can be configured to dump the VMkernel memory to a network server rather than to a local disk when the system has encountered a critical failure. The Collector collects the dumps across the network. This is useful for ESXi hosts that are configured by the VMware Auto Deploy process and might not have local storage. A core dump is the state of working memory in the event of host failure.

Prerequisites

  • Verify that you have administrator privileges
  • Verify that the host machine has Windows Installer 3.0 or later.
  • Verify that the host machine has a supported processor and operating system. The Dump Collector supports the same processors and operating systems as vCenter Server. See vCenter Server Software Requirements and vCenter Server and vSphere Client Hardware Requirements.
  • Verify that the host machine has a valid IPv4 address. You can install the Dump Collector on a machine in an IPv4-only or IPv4/IPv6 mixed-mode network environment, but you cannot install the Dump Collector on a machine in an IPv6-only environment.
  • If you are using a network location for the Dump Collector repository, make sure the network location is mounted.

Install and Configure

  • Open the vCenter Installer and select ESXi Dump Collector

Dump1

  • Select your language

Dump2

  • Select Next

dump3

  • Click Next

dump4

  • Click I accept > Next

dump5

  • Select the folder locations you want

dump6

  •  Select the type of installation

dump7

  • Enter the vCenter details

dump8

  • Say Yes to the SSL Cert

dump9

  •  Select the Port

dump10

  • Specify the name on the network

dump11

  • Click Install

dump12

  • You can then see the icon for the VMware ESXi Dump Collector on the Home Page

dumpicon

  • Set  up an ESXi system to use ESXi Dump Collector by running esxcli
    system coredump in the local ESXi shell or by using vCLI
  • Run esxcli system coredump network set –interface-name=vmk0 –server-ipv4=192.168.232.30 –server-port=6500
  • Run esxcli system coredump network set –enable true
  • Run esxcli system coredump network get to check everything is setup as expected

Capture2

  • Under Home > Administration > VMware ESXi Dump Collector, you will now see the following

dump

VMware Dump Collector Doc

http://kb.vmware.com/selfservice/microsites/search.do?language=en_US&cmd=displayKC&externalId=1032051

Configuring and Testing Centralised Logging Configuration

syslog14

Commands for configuring Syslog

logging

Procedure for configuring and Testing Logging

When everything has been installed configured correctly in terms of the Syslog Collector, log files should show up in the Syslog server following the last pieces of config information as per below

  • Log into vCenter
  • Check on each host that the firewall has been adjusted to allow syslog

sysfirewall

  • Go to Home > Administration > Network SysLog Collector
  • You will see information related to the setup and the log file locations

syslog16

  • Open an SSH session on every host and type the following 2 commands
  • Don’t forget to reload the configuration

syslog17

  • You can check if this been set in the hosts Advanced Settings
  • Assuming you are sending logs to a Syslog collector named loghost.company.corp, you would enter one of the following in the Syslog.global.logHost field:
  • udp://loghost.company.corp:514
  • tcp://loghost.company.corp:514
  • ssl://loghost.company.corp:1514

syslog18

  • Go to c:\ProgramData\VMware\VMware Syslog Collector\Data
  • You should be able to see a folder created for each host called the host name

syslog19

  • If you go back to the Network Syslog collector and you are not seeing your hosts but you are getting logs collected in your designated location then log out and into vClient again

Capture

What you will see

  • A folder has been created for every ESXi host, identified by the management IP address;
  • In each folder a single file, named syslog.log, containing entries from the Hostd.log and the Vpxa.log

If logging does not show up, try the following:

  • Check the configuration of the ESXi host, especially the syntax of the loghost
  • Check the configuration of the ESXi firewall, outgoing syslog allowed
  • On the ESXi host, try restarting the Managent Agent. From the DCUI or # /sbin/services.sh restart
  • On the Syslog server, also check the firewall settings, is incoming traffic allowed?
  • Try to connect to the Syslog server using the telnet command, e.g.: > telnet Syslog server> 514
  • In case you use the “Network Syslog Collector”, review the settings
  • Restart the vClient as this sometimes refreshes the Network Syslog Collector View

VMware Doc

http://kb.vmware.com/selfservice/microsites/search.do?language=en_US&cmd=displayKC&externalId=2003322