vRealize Log Insight and Operations Manager Integration
VMware vRealize Log Insight delivers heterogeneous and highly scalable log management with intuitive, actionable dashboards, sophisticated analytics and broad third party extensibility, providing deep operational visibility and faster troubleshooting.
Sophisticated and scalable log analytics and log management organizes chaotic log data and gives you meaningful, actionable insights across multiple tiers of a hybrid cloud environments
Useful link
- Download the Log Insight appliance from here
- Import the OVF into vCenter
- Power on the Log Insight Appliance
- Connect to the IP address you set as your Log Insight Appliance Address – https://<Log Insight FQDN>
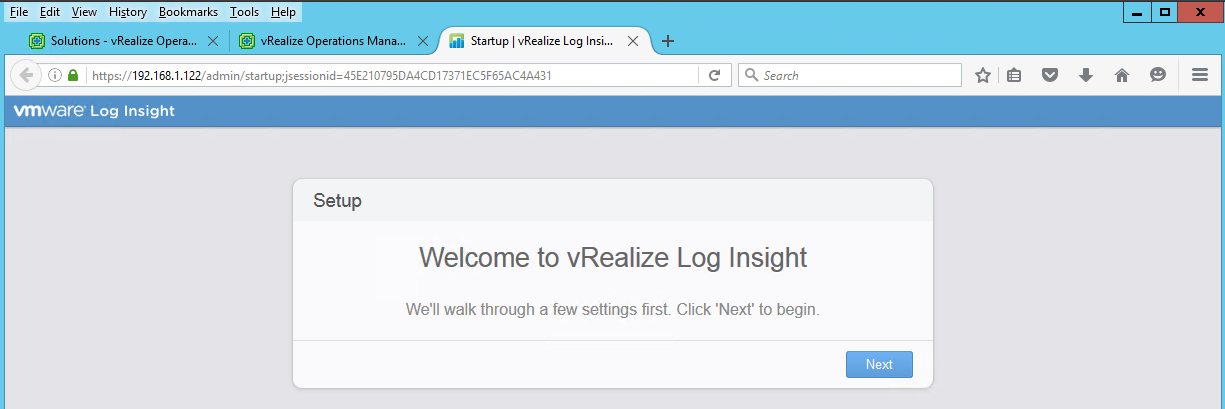
- Click Next
- Click Start New Deployment
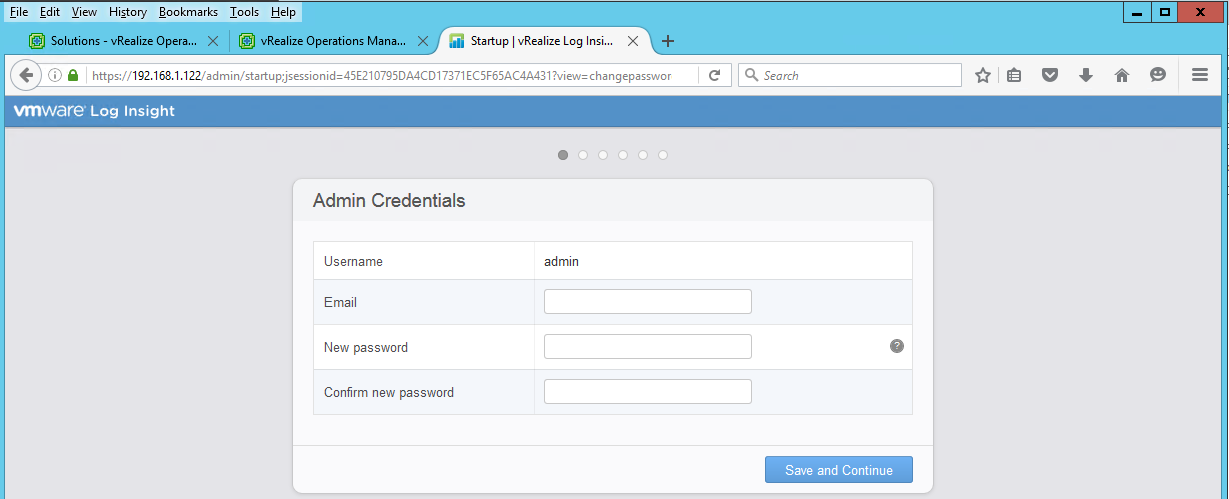
- Put in Admin Credentials
- Put in a License key
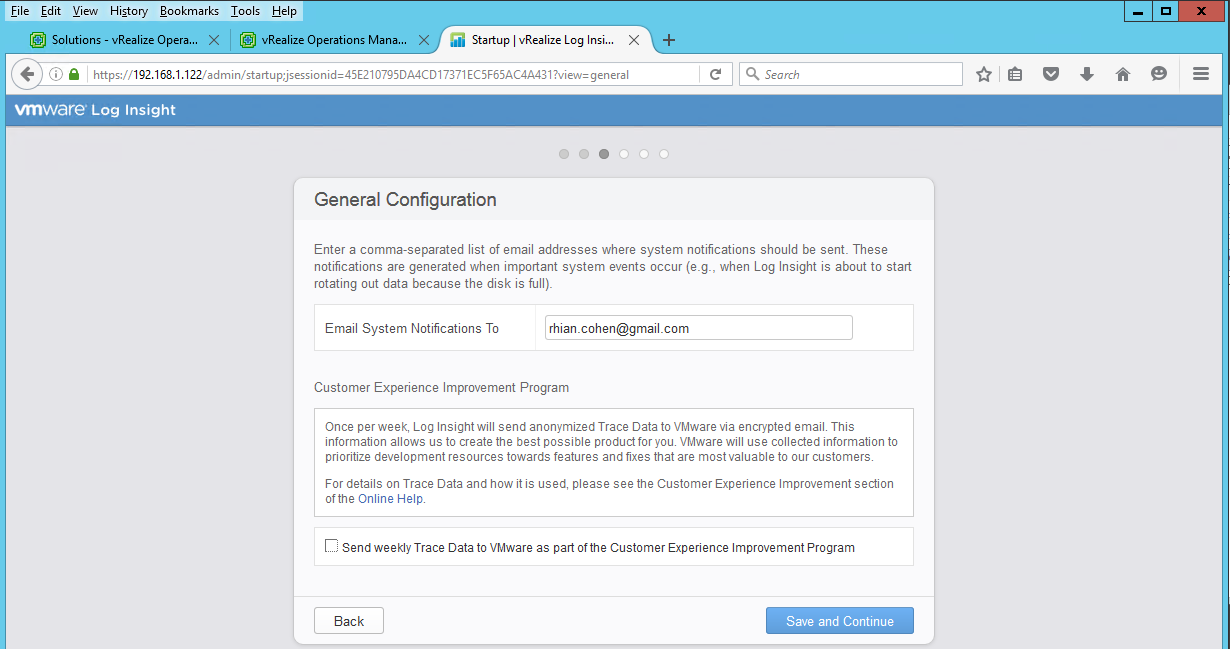
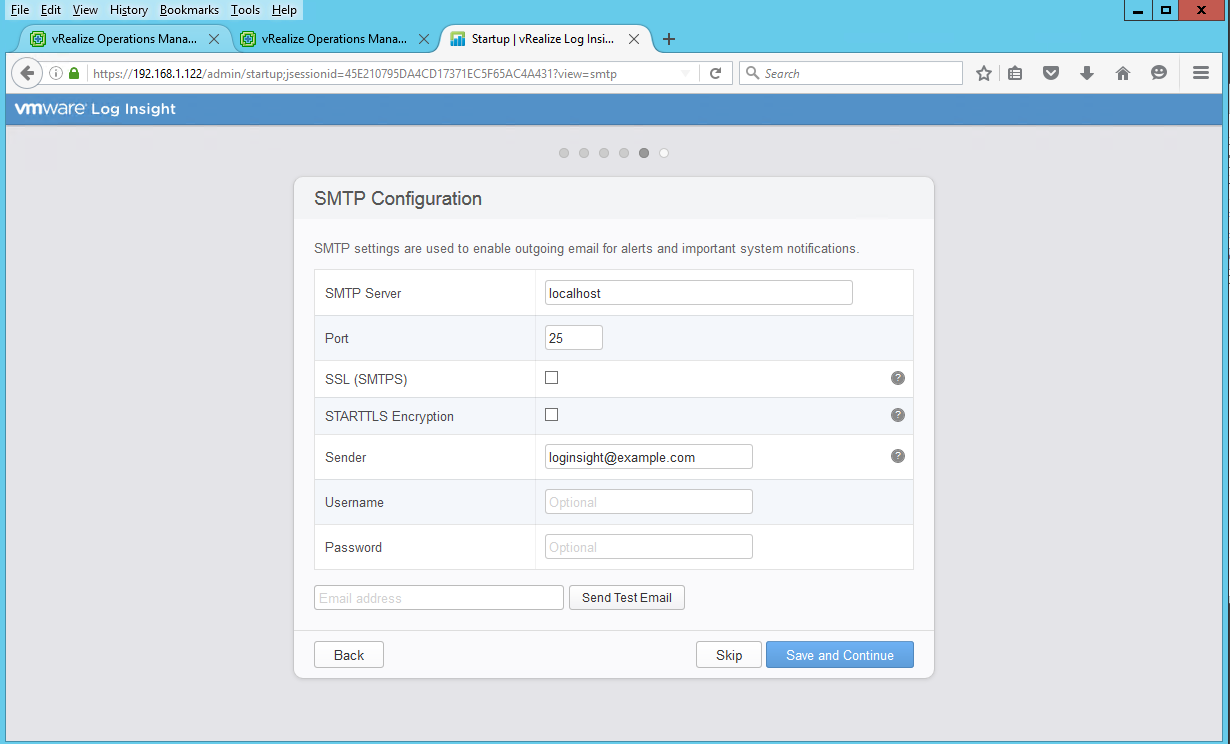
- Put in an email and check whether you want to join the customer experience program
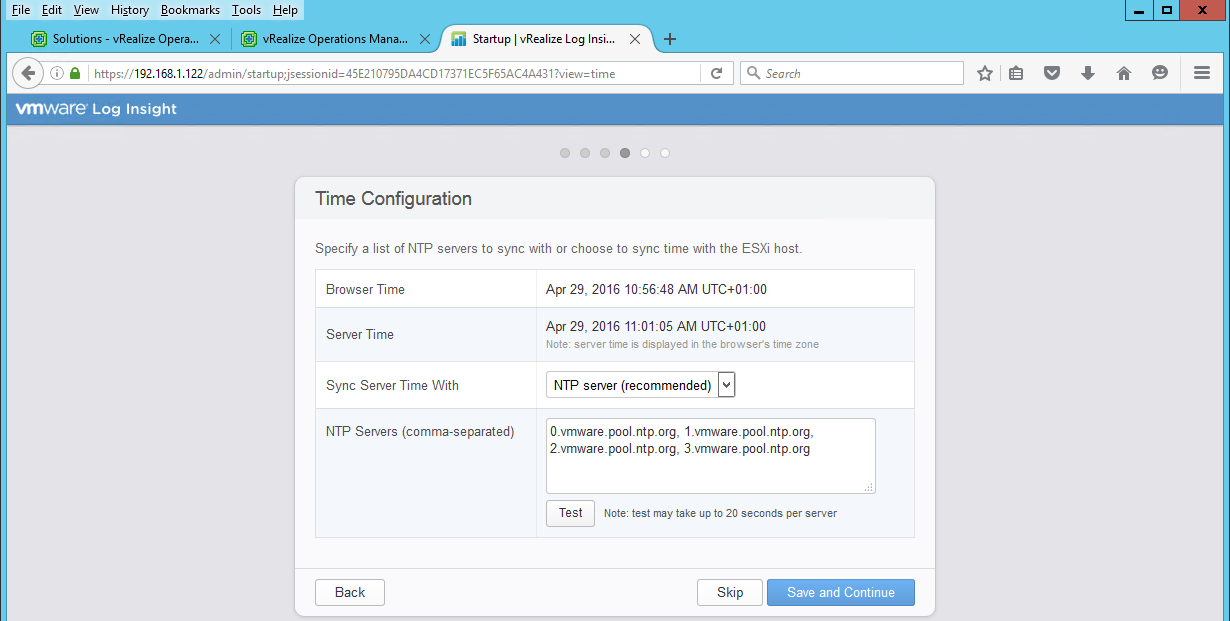
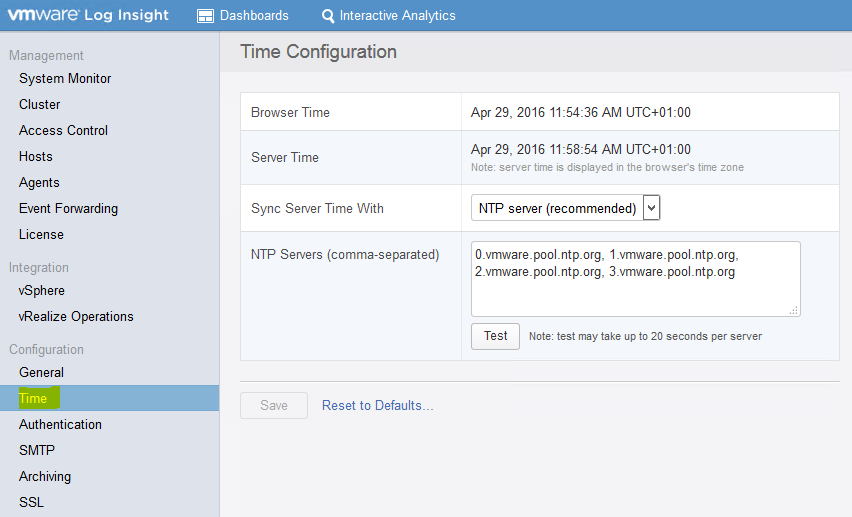
- Set the Time Configuration and test it. You can choose your own NTP server or sync with your ESXi hosts
- Set your NTP Configuration
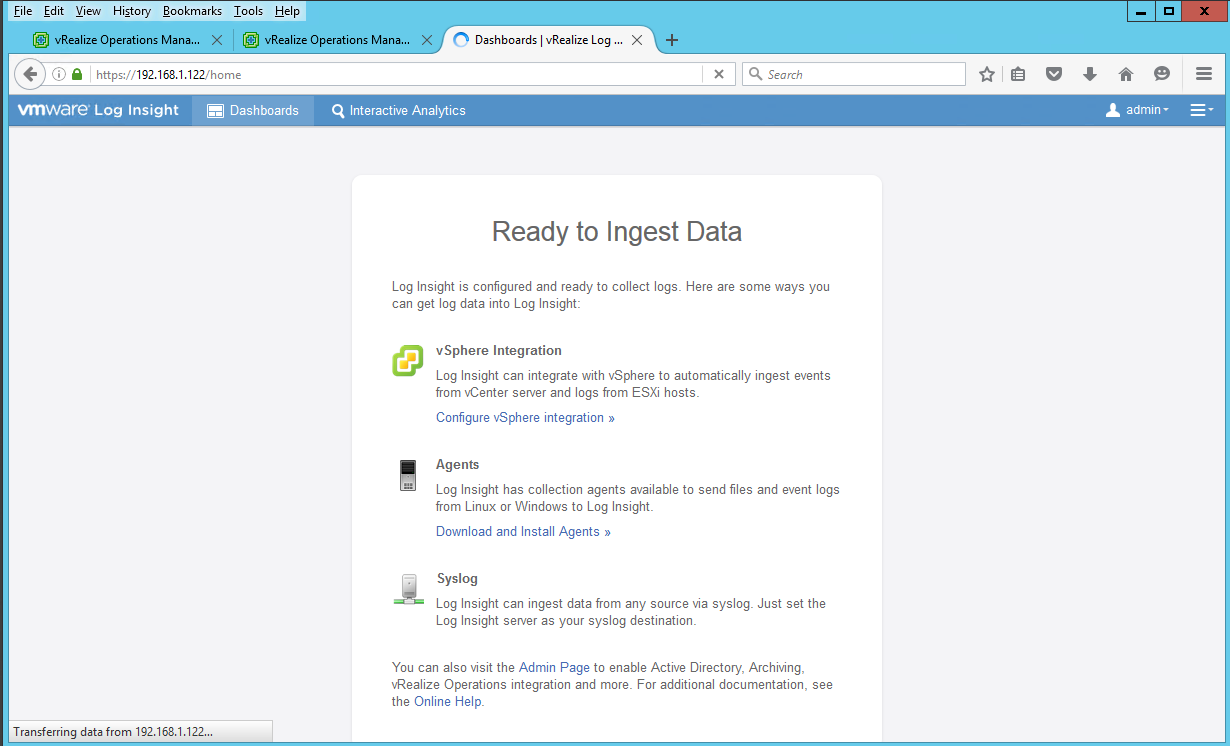
- Finish the Configuration
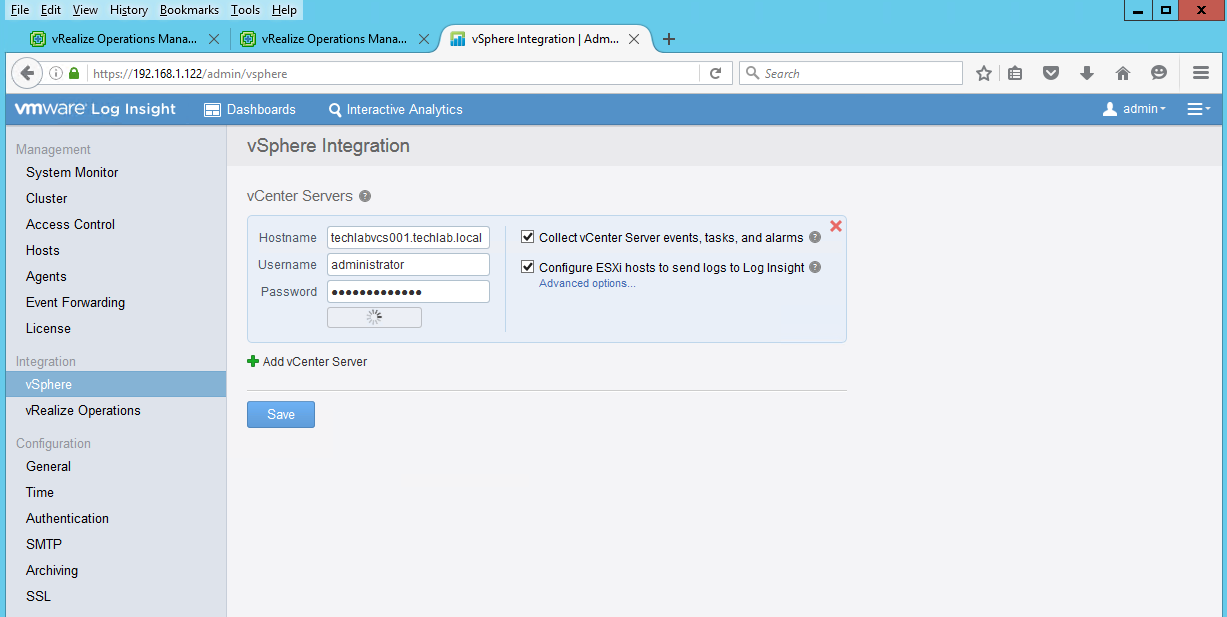
- Click Configure vSphere Integration
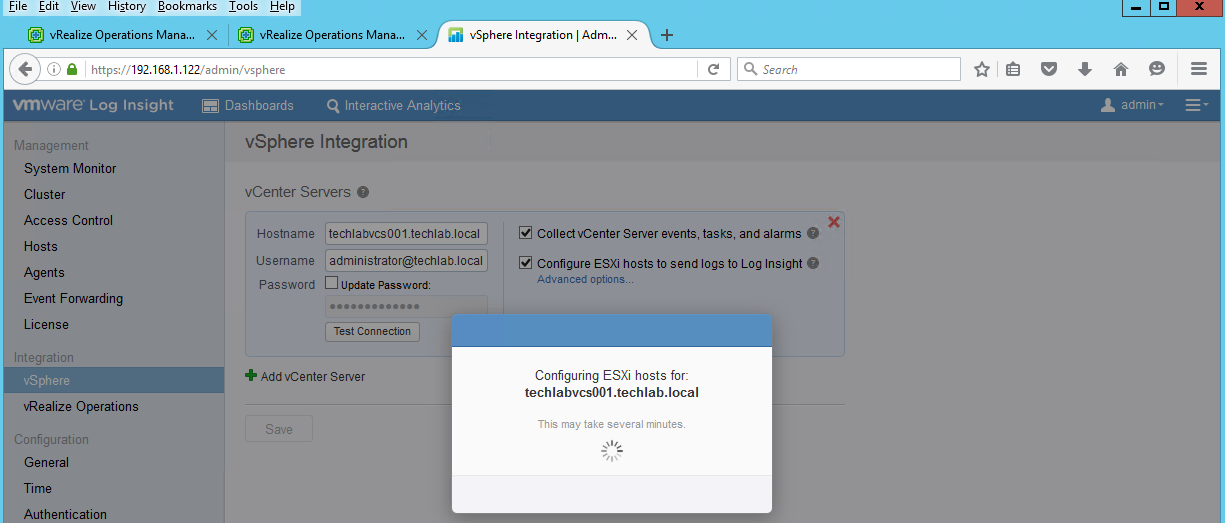
- Put in your vCenter Server and username and password and test connection
- It will then configure your hosts
A quick look through the Admin Pages
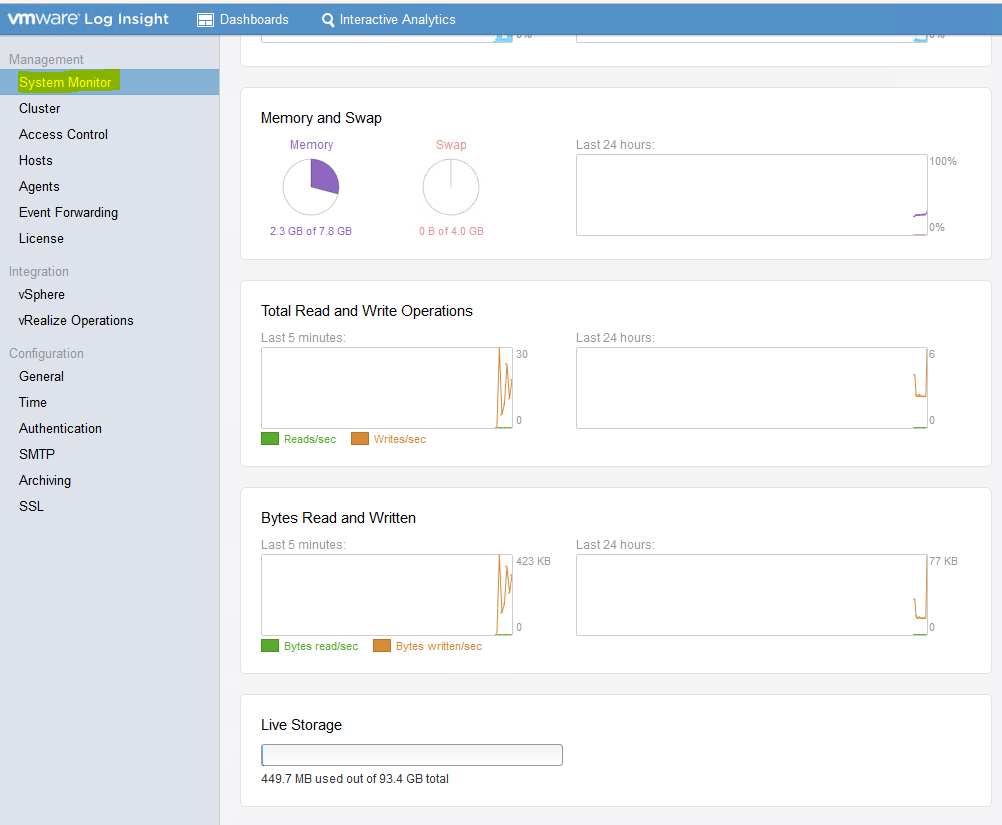
- System Monitor
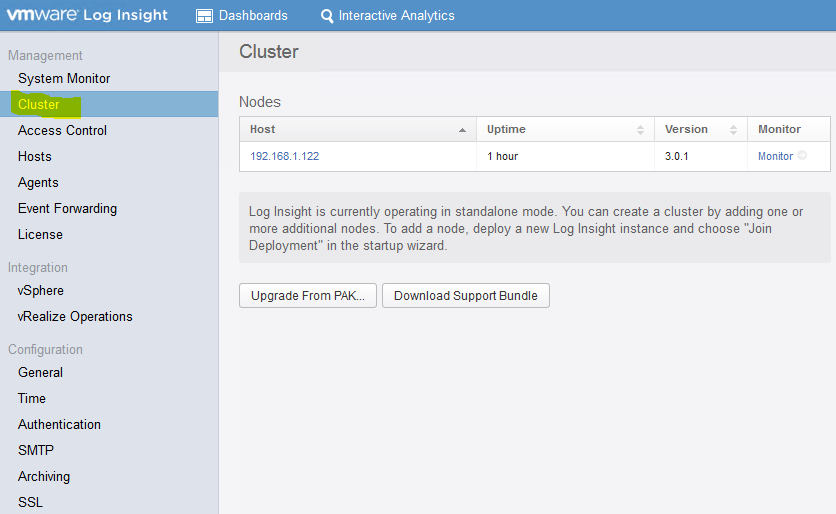
- Cluster
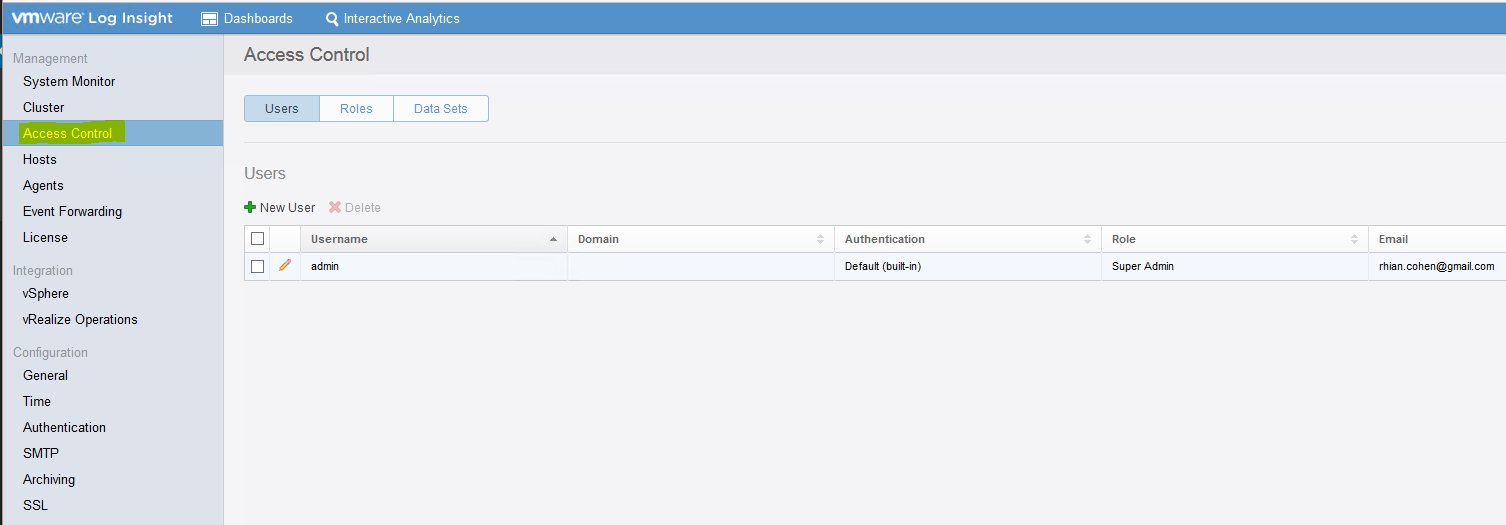
- Access Control
- Hosts
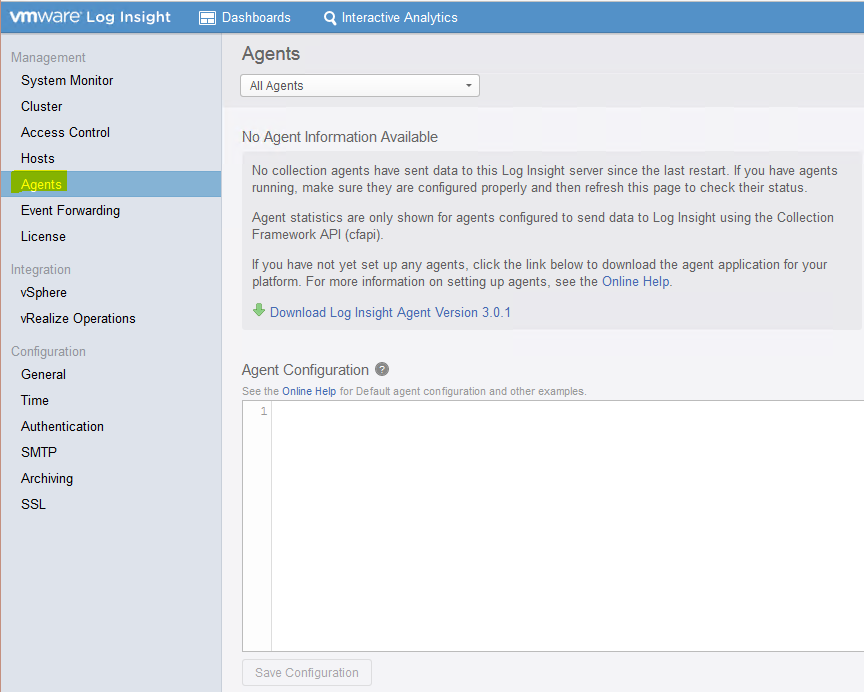
- Agents
- Event Forwarding
- License
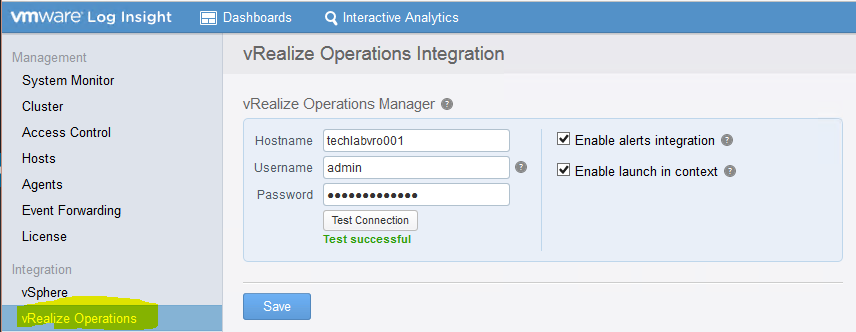
- vRealize Operations Integration
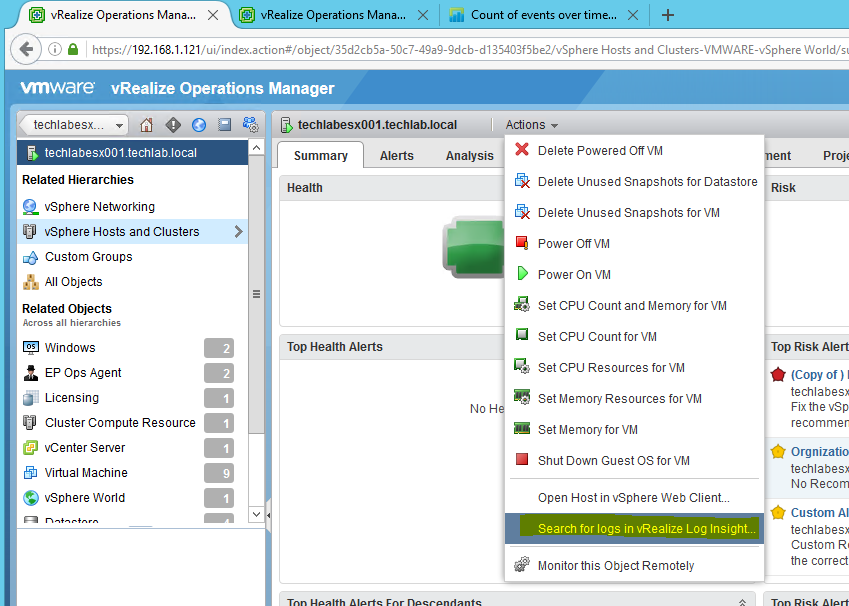
When you enable launch in context you will then get another menu option on an object in vROps as seen below
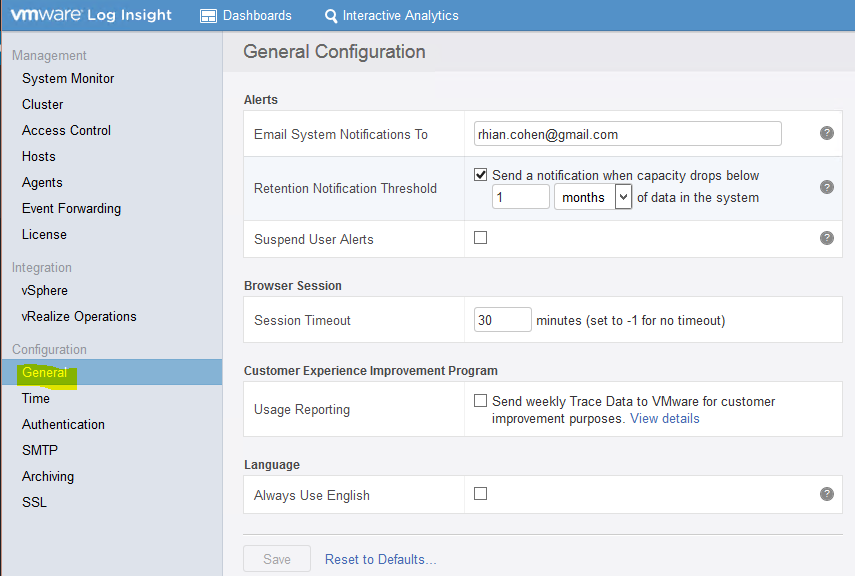
- General
- Time
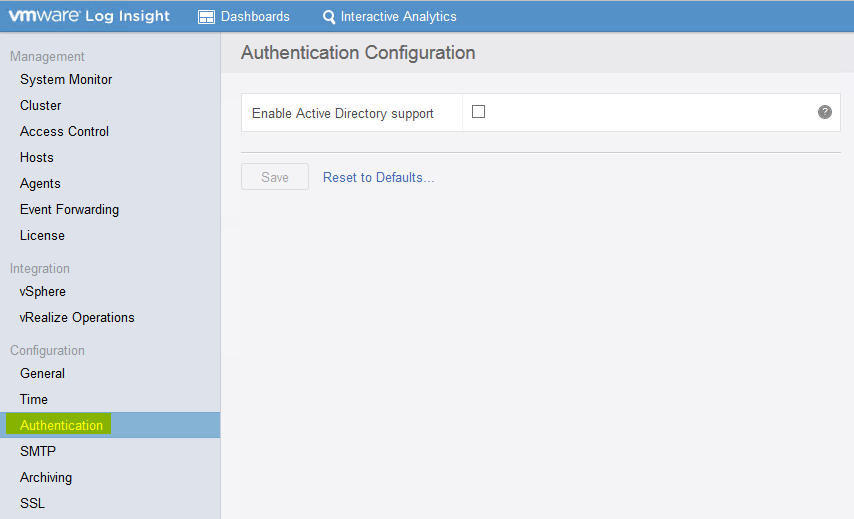
- Authentication
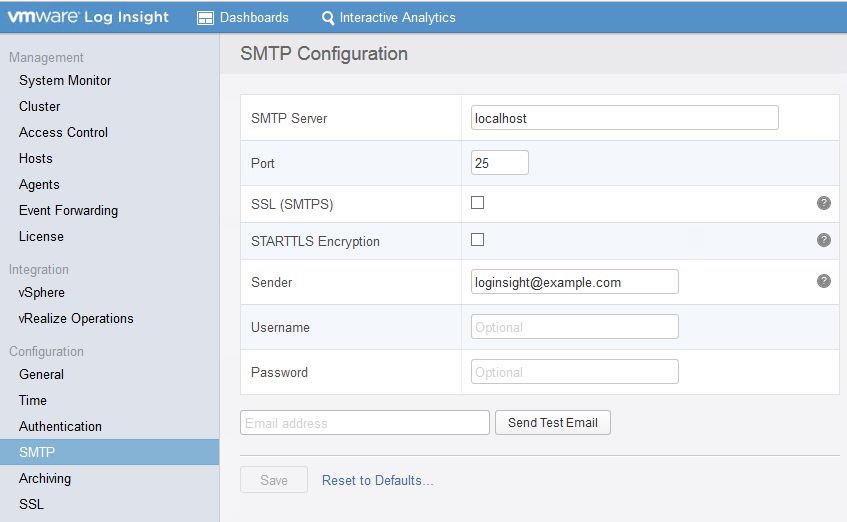
- SMTP
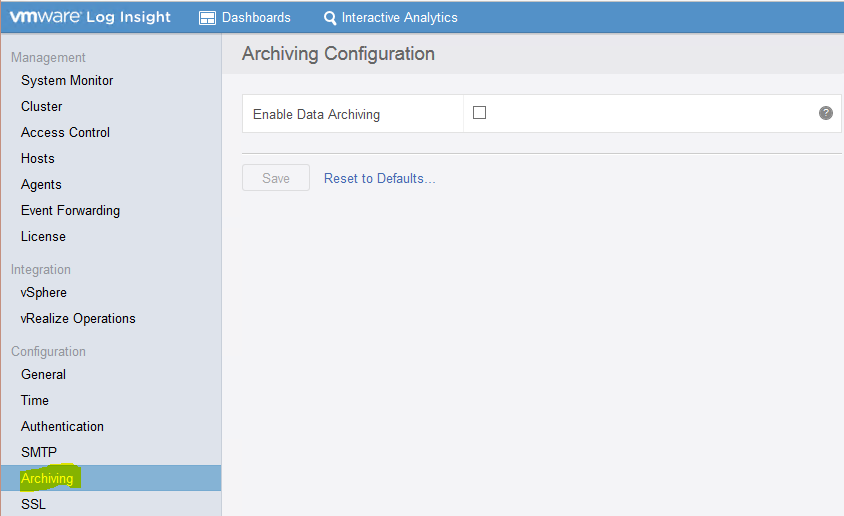
- Archiving
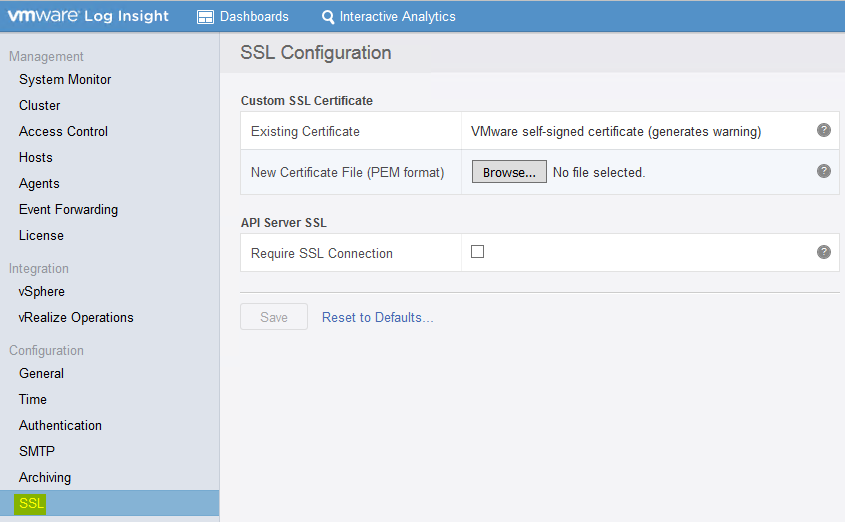
- SSL
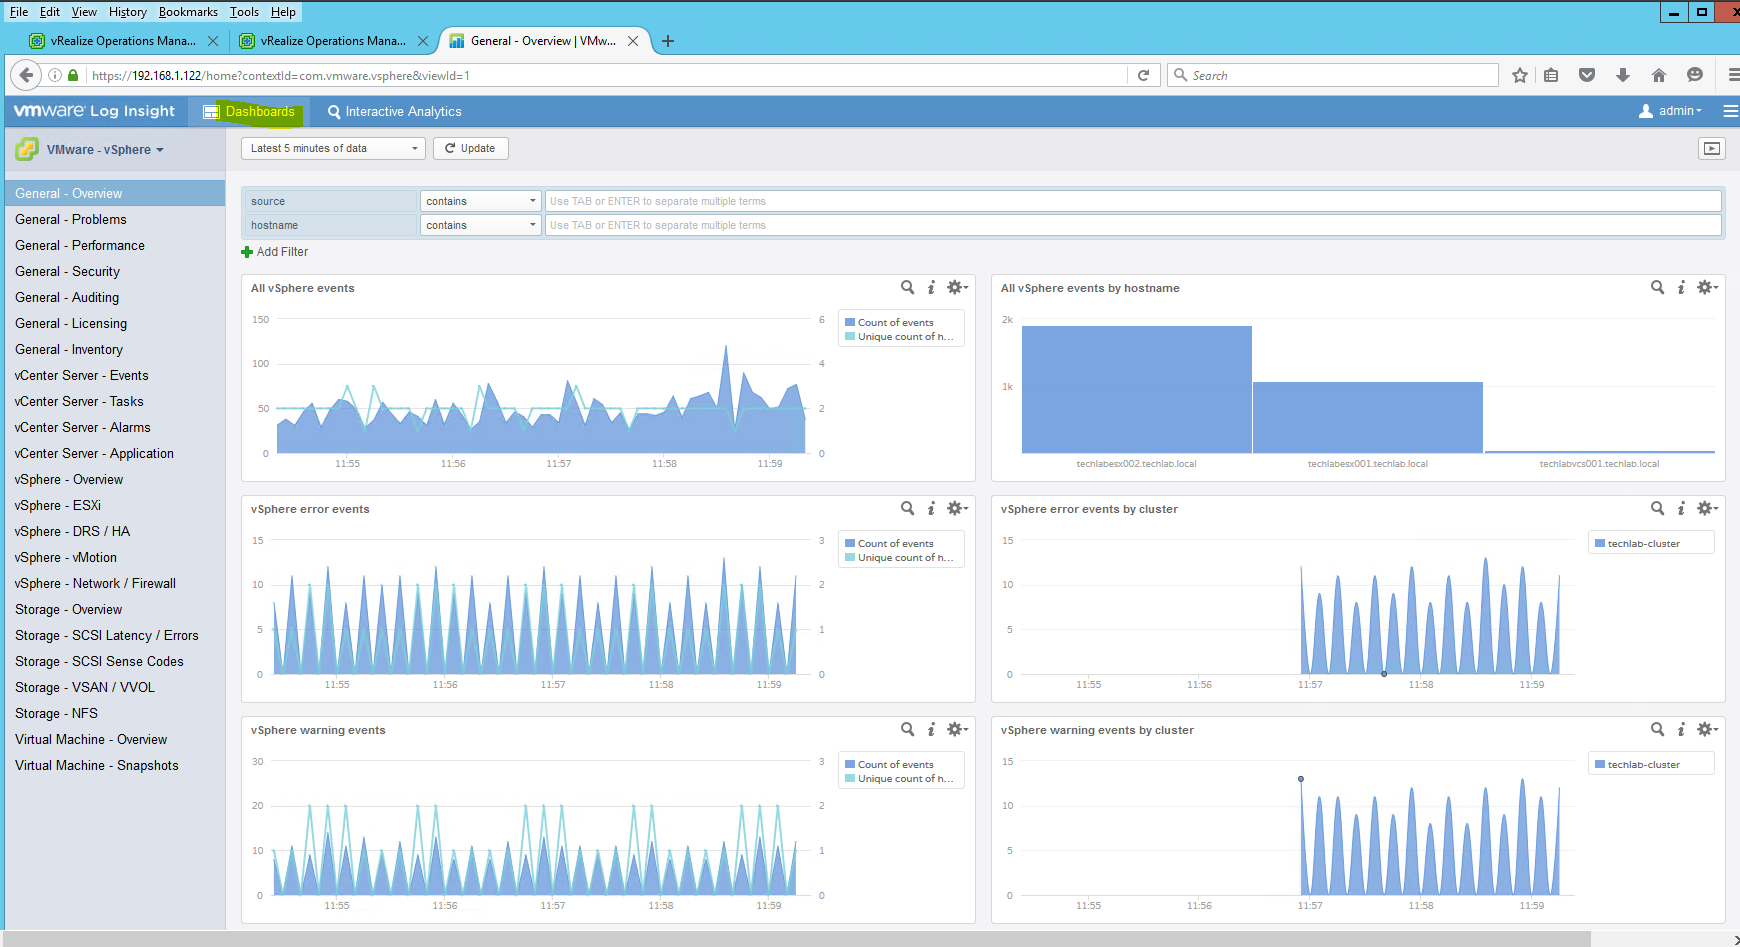
Next The Default Dashboards Screen
Dashboards are a collection of different charts or queries.
The screen is divided into four parts parts:
- The menubar, all the way to the top
- The dashboard selection. It’s the left part of the screen
- The widget/chart area, which is the bottom part of the screen on the right
- The filtering area, which is the top part of the screen on the right
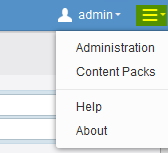
in the top right hand corner, you can click on the drop down by Admin to change your password and e-mail address or if you want to change settings or add management packs to Log Insight (the three bars)
What can you do with dashboards?
- You can create your own dashboards with useful metrics that you want to monitor closely.
- Any query can be turned into a dashboard widget and visualized for any range in time.
- You can check the performance of your system for the last hour, day, or week.
- You can view a break down of errors by hour and observe the trends in log events.
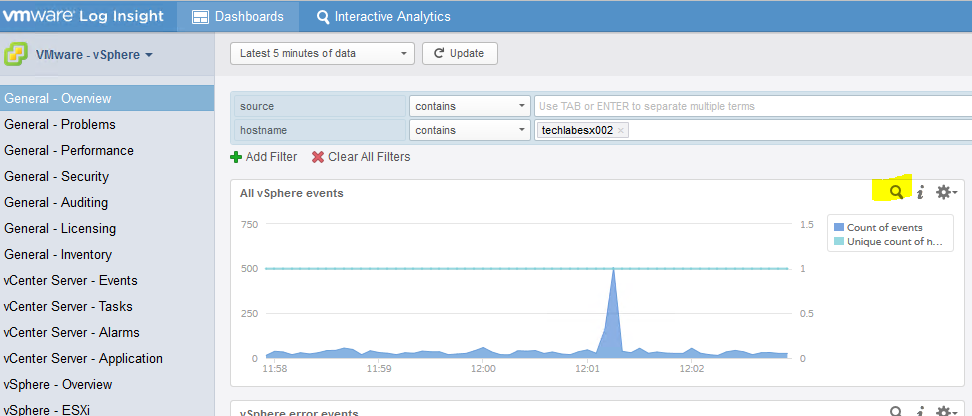
You can filter by hostname
You can open the Interactive Analytics by clicking on the Search icon highlighted in yellow below
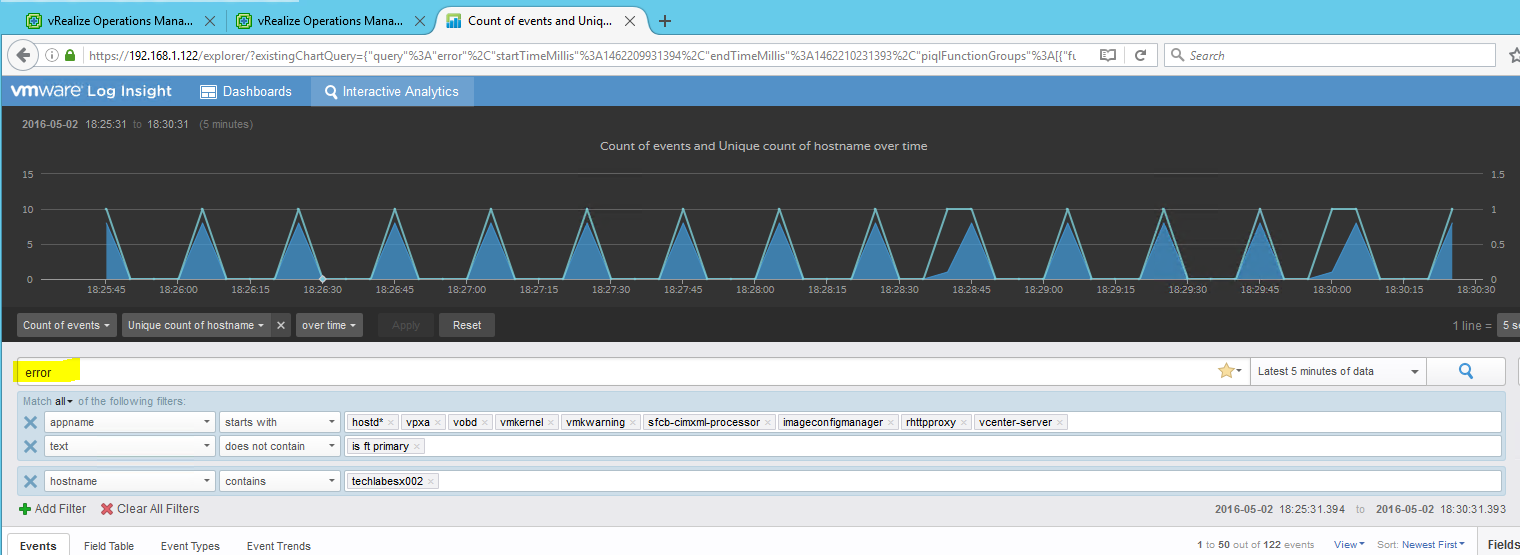
Within the Interactive Analytics page we can click on the highlighted icon Area to choose a type of chart to display
We can start typing a keyword into the box which will bring up other keywords you could use as well
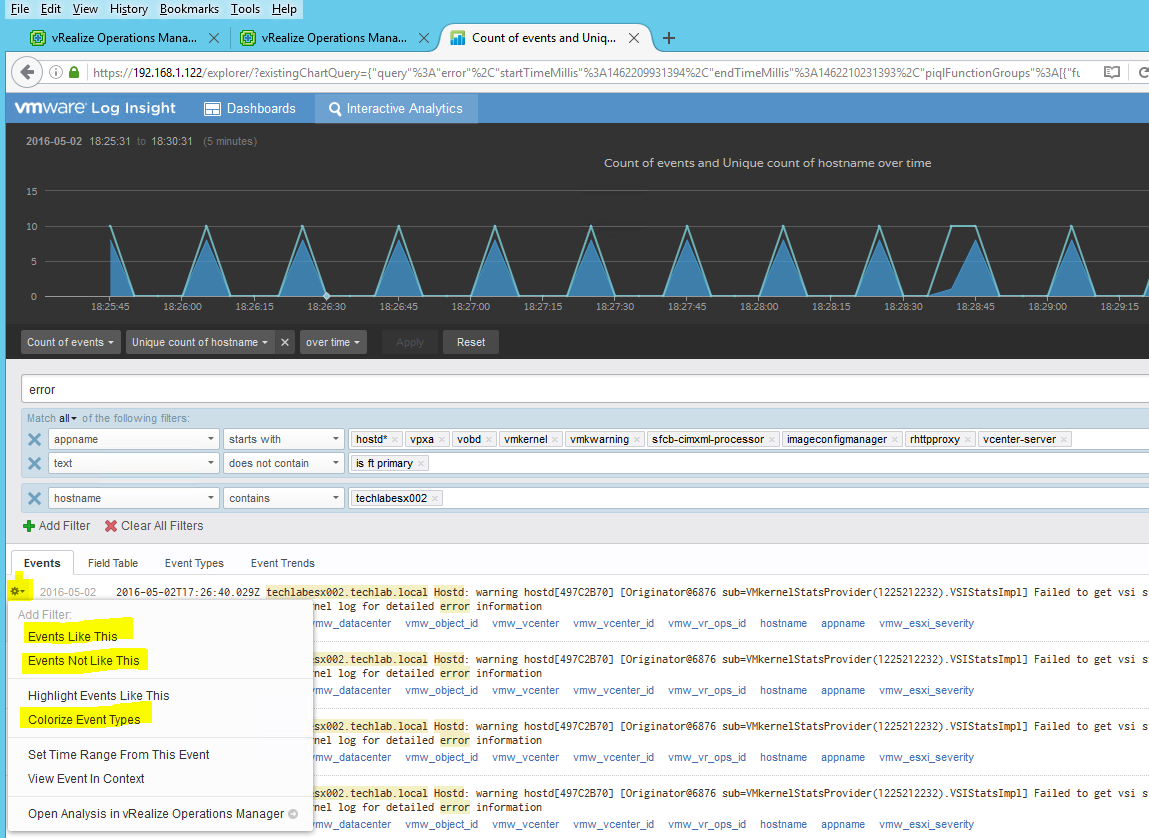
Clicking on the gear icon to the left on an error message will bring up even more options allowing you to filter further and colourise events and errors
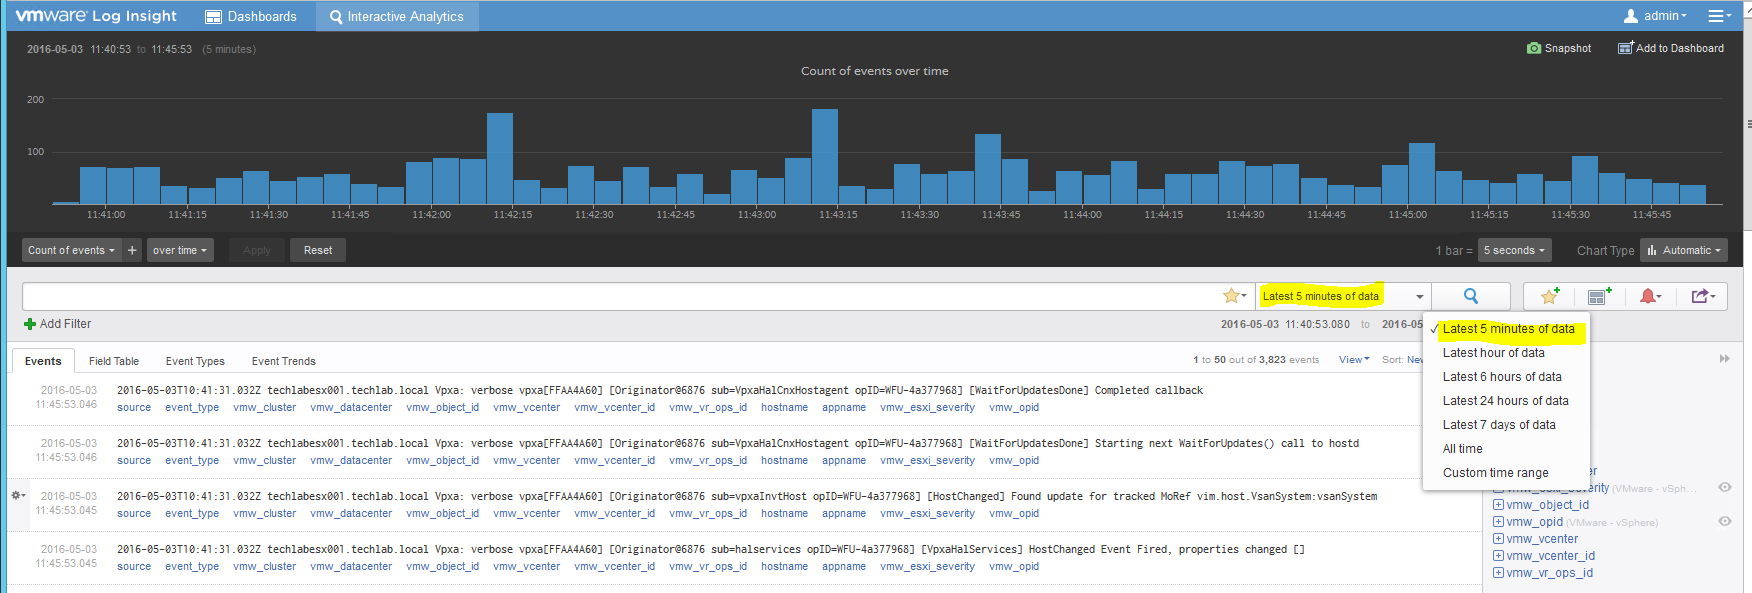
You can set the time interval you want to look at
There are 4 icons next to the time interval
- You can add a current query you have built to your Favourites
- You can add the current query to a dashboard
- You can create or manage alerts
- You can export or share a current query
There are another 4 tabs above the events where you can also see different information
- Events
This lists all the events seen under the current query or default view
- Field Table
A Field Table that contains events where each field represents a column. A dashboard field table widget contains the latest events for the given query in a table format where each field represents a column.
You can use a field table widget for the following reasons.
|
■
|
To see the latest events for the given query. This can be useful for change management or for security reasons. |
|
■
|
To see only the fields you care about for a given query. This can be useful to limit event output |
- Event Types
The event Types tab is located on the Interactive Analytics page, under the search bar. When you click the event Types tab you see a list of similar events that are grouped together.
Machine learning analyzes events and discovers the types of fields that similar log messages contain. For example, the types may be timestamp, string, int, hex and others. The discovered types appear as hyperlinks within the event Types list.
Each type that machine learning discovers represents a new type of field called smart field. The default name of a smart field follows the format smart field – type number [event_type]. You can change the default name of a smart field. After you name a smart field, it appears under the Fields section just like other fields. You can rename or delete a smart field but you cannot modify its definition.
Machine learning introduces a new static field called event_type. You can use the event_type as a filter to include or exclude certain event types from queries
- Event Trends
You can analyze log events for trends and anomalies.
Procedure
|
1
|
Navigate to the Interactive Analytics tab. |
|
2
|
Construct and run your query by using the search text box and applying filters. |
|
3
|
In the Set Time Range From Event dialog box, use the drop-down menus to select the period and direction of the time range. |
|
4
|
Click the Event Trends tab. Realize Log Insight compares your query to the same time period immediately before and displays the result |
Fields
You can create your own custom fields to search from by doing the following
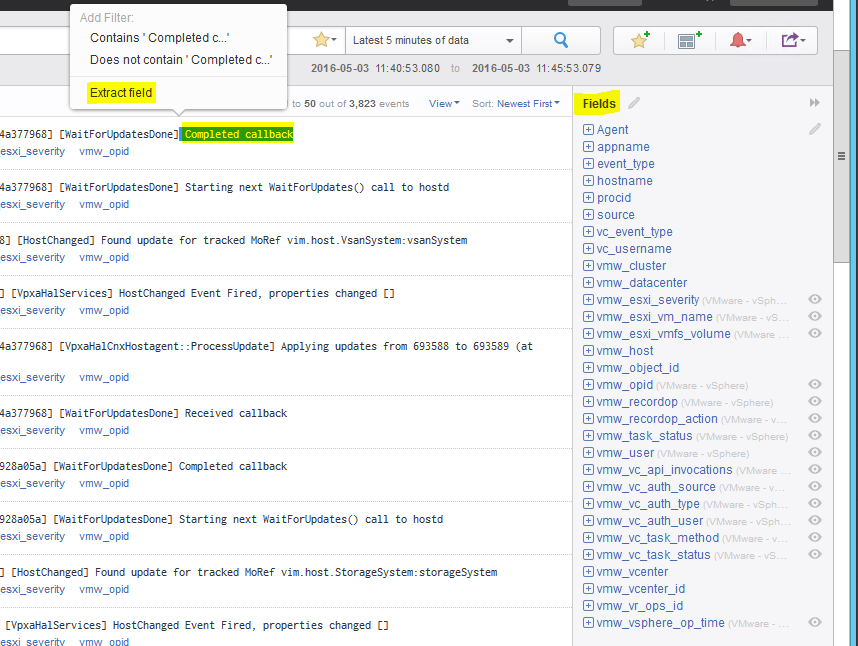
- Look at Events and the keywords you may want to reuse in future searches
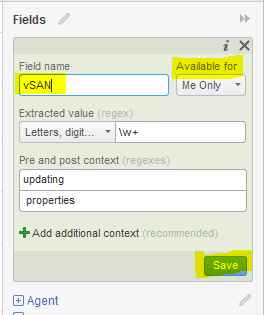
- Highlight the word and select Extract to field
- Name the field
- This can then be reused












Leave a Reply