Archive for November 2012

Microsoft Windows Powershell

What is PowerShell?

Windows PowerShell is Microsoft’s task automation framework, consisting of a command-line shell and associated scripting language built on top of .NET Framework. PowerShell provides full access to COM and WMI, enabling administrators to perform administrative tasks on both local and remote Windows systems.

In PowerShell, administrative tasks are generally performed by cmdlets (pronounced command-lets), specialized .NET classes implementing a particular operation. Sets of cmdlets may be combined together in scripts, executables (which are standalone applications), or by instantiating regular .NET classes (or WMI/COM Objects) These work by accessing data in different data stores, like the filesystem or registry, which are made available to the PowerShell runtime via Windows PowerShell providers.

Windows PowerShell also provides a hosting API with which the Windows PowerShell runtime can be embedded inside other applications. These applications can then use Windows PowerShell functionality to implement certain operations, including those exposed via the graphical interface. This capability has been used by Microsoft Exchange Server 2007  to expose its management functionality as PowerShell cmdlets and providers and implement the graphical management tools as PowerShell hosts which invoke the necessary cmdlets. Other Microsoft applications including Microsoft SQL Server 2008 also expose their management interface via PowerShell cmdlets. With PowerShell, graphical interface-based management applications on Windows are layered on top of Windows PowerShell. A PowerShell scripting interface for Windows products is mandated by the Common Engineering Criteria.

Windows PowerShell includes its own extensive, console-based help, similar to man pages in Unix shells, via the Get-Help cmdlet.

Microsoft Page for PowerShell

http://technet.microsoft.com/en-us/library/bb978526.aspx

5 Introductory Videos

http://technet.microsoft.com/en-us/scriptcenter/dd742419.aspx

Hey Scripting Guy WebPage

http://blogs.technet.com/b/heyscriptingguy/

Technet Virtual Lab – PowerShell

https://msevents.microsoft.com/CUI/EventDetail.aspx?culture=en-US&EventId=1032314395

Script Resources for IT Professionals

http://gallery.technet.microsoft.com/scriptcenter

Iometer

What is Iometer?

Iometer is an I/O subsystem measurement and characterization tool for single and clustered systems. It is used as a benchmark and troubleshooting tool and is easily configured to replicate the behaviour of many popular applications. One commonly quoted measurement provided by the tool is IOPS

Iometer can be used for measurement and characterization of:

  • Performance of disk and network controllers.
  • Bandwidth and latency capabilities of buses.
  • Network throughput to attached drives.
  • Shared bus performance.
  • System-level hard drive performance.
  • System-level network performance.

Documentation

http://iometer.cvs.sourceforge.net/*checkout*/iometer/iometer/Docs/Iometer.pdf

http://communities.vmware.com

Downloads

http://www.iometer.org/doc/downloads.html

YouTube

Iometer Tutorial Part 1

Iometer Tutorial Part 2

Iometer Tutorial Part 2b

What are IOPs?

IOPS (Input/Output Operations Per Second, pronounced eye-ops) is a common performance measurement used to benchmark computer storage devices like hard disk drives (HDD), solid state drives (SSD), and storage area networks (SAN). As with any benchmark, IOPS numbers published by storage device manufacturers do not guarantee real-world application performance.

IOPS can be measured with applications, such as Iometer (originally developed by Intel), as well as IOzone and FIO and is primarily used with servers to find the best storage configuration.

The specific number of IOPS possible in any system configuration will vary greatly, depending upon the variables the tester enters into the program, including the balance of read and write operations, the mix of sequential and random access patterns, the number of worker threads and queue depth, as well as the data block sizes.There are other factors which can also affect the IOPS results including the system setup, storage drivers, OS background operations, etc. Also, when testing SSDs in particular, there are preconditioning considerations that must be taken into account

Performance Characteristics

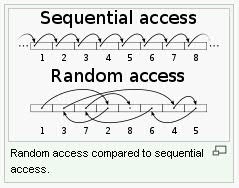
The most common performance characteristics measured are sequential and random operations. Sequential operations access locations on the storage device in a contiguous manner and are generally associated with large data transfer sizes, e.g. 128 KB. Random operations access locations on the storage device in a non-contiguous manner and are generally associated with small data transfer sizes, e.g. 4 KB.

The most common performance characteristics are as follows

Installing and Configuring Iometer

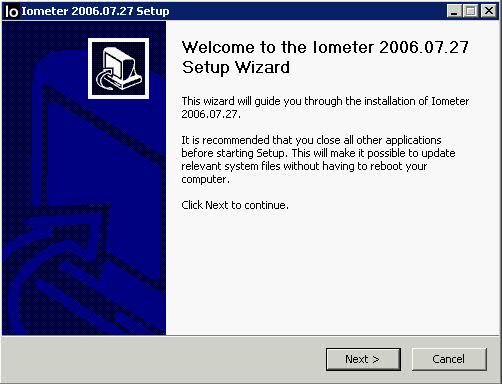
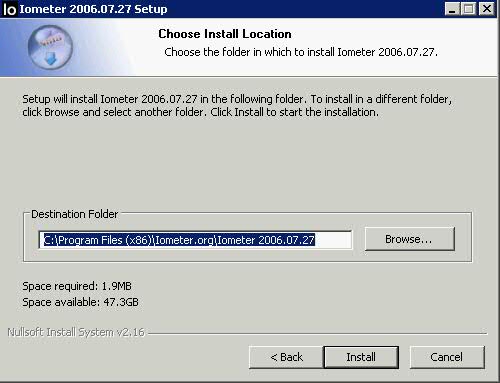
  • Click on the .exe

  • Click Next

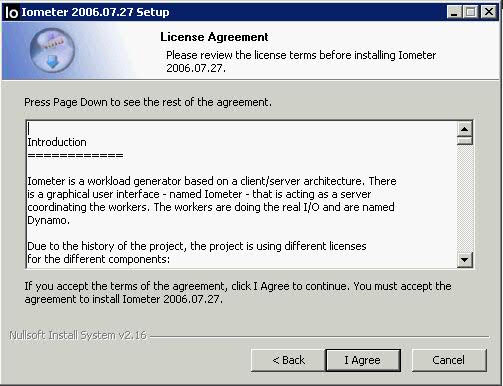
  • Click I agree

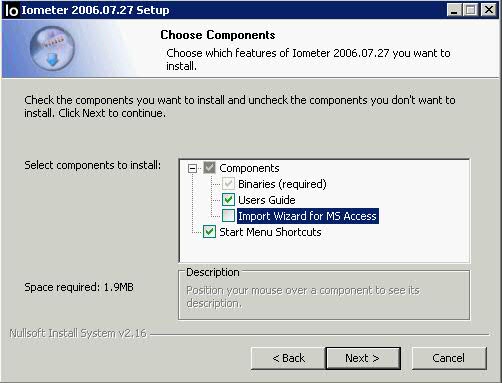
  • Click Next

  • Click Install

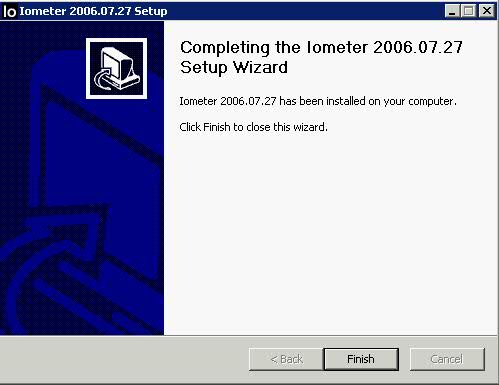
  • Click Finish
  • You should see everything installed as per below

  • Open Iometer AS AN ADMINISTRATOR. (not running as Administrator means you don’t see any drives)
  • Accept License
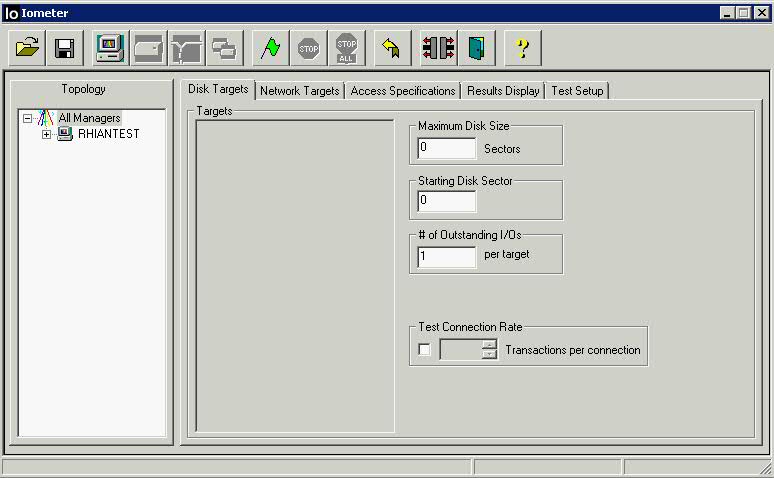
  • The Iometer GUI appears, and Iometer starts one copy of Dynamo on the same machine.

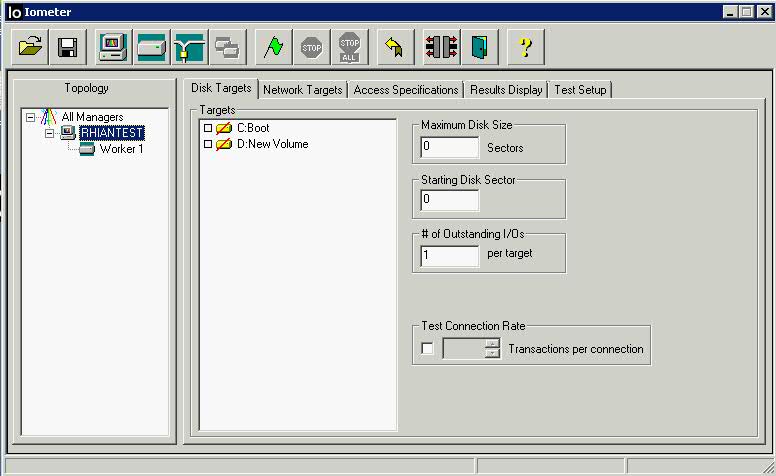
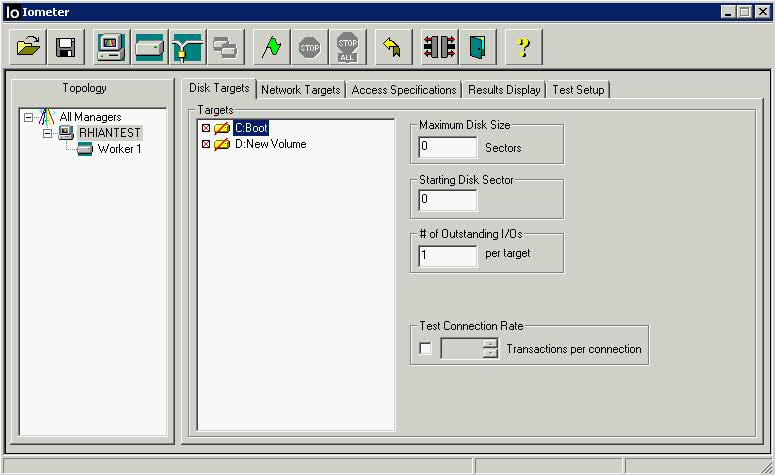
  • Click on the name of the local computer (Manager)in the Topology panel on the
    left side of the Iometer window. The Local Computer (Manager’s) available disk drives appear in the Disk Targets tab. Blue icons represent physical drives; they are only shown if they have no partitions on them. Yellow icons represent logical (mounted) drives; they are only shown if they are writable. A yellow icon with a red slash through it means that the drive needs to be prepared before the test starts
  • Disk workers access logical drives by reading and writing a file called iobw.tst in the root directory of the drive. If this file exists, the drive is shown with a plain yellow icon; if the file does not exist, the drive is shown with a red slash through the icon. (If this file exists but is not writable, the drive is considered read-only and is not shown at all.)
  • If you select a drive that does not have an iobw.tst file, Iometer will begin the test by creating this file and expanding it until the drive is full

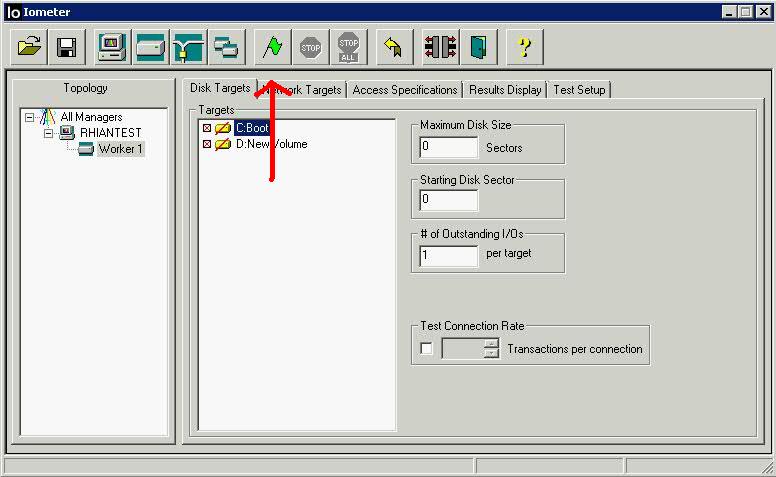
  •  The Disk Targets tab lets you see and control the disks used by the disk worker(s currently selected in the Topology panel. You can control which disks are used, how much of each disk is used, the maximum number of outstanding I/Os per disk for each worker, and how frequently the disks are opened and closed.
  • You can select any number of drives; by default, no drives are selected. Click on a single drive to select it; Shift-click to select a range of drives; Control-click to add a drive to or remove a drive from the current selection

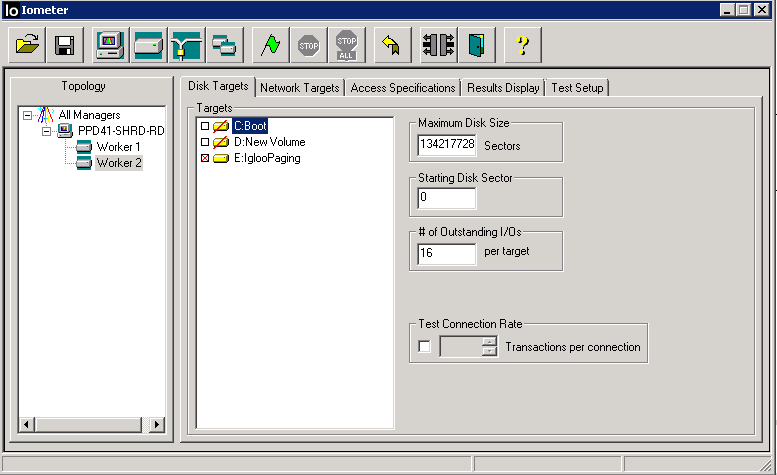
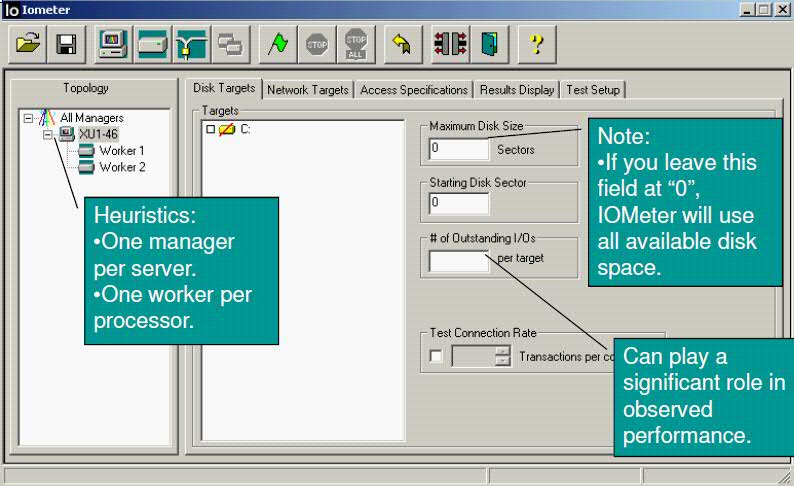
  • The Worker underneath your Machine Name – This will default to one worker (thread) for each physical or virtual  processor on the system.  In the event that Iometer is being used to  compare native to virtual performance, make sure that the worker numbers  match!
  • The Maximum Disk Size control specifies how many disk sectors are used by the
    selected worker(s). The default is 0, meaning the entire disk. Then the important part is to fill in the Maximum Disk Size. If you don’t do this, then the first time you run a test, the program will attempt to fill the entire drive with its test file!
  • You want to create a file which is much larger than the amount of RAM in your system however sometimes this is not practical if you have servers that are 24GB or 32GB etc
  • Please use the following link www.unitconversion.org/data-storage/blocks-to-gigabytes-conversion.html to get a proper conversion of blocks to GBs for a correct figure to put in Maxim Disk size
  • E.g. 1GB = 2097152
  • E.g. 5GB = 10485760
  • E.g. 10GB = 20971520
  • The Starting Disk Sector control specifies the lowest-numbered disk sector used by the selected worker(s) during the test. The default is 0, meaning the first 512-byte sector in the disk
  • The # of Outstanding I/Os control specifies the maximum number of outstanding asynchronous I/O operations per disk the selected worker(s) will attempt to have active at one time. (The actual queue depth seen by the disks may be less if the operations complete very quickly.) The default value is 1 but if you are using a VM, you can set this to the queue depth value which could be 16 or 32
    Note that the value of this control applies to each selected worker and each selected disk. For example, suppose you select a manager with 4 disk workers in the Topology panel, select 8 disks in the Disk Targets tab, and specify a # of Outstanding I/Os of 16. In this case, the disks will be distributed among the workers (2 disks per worker), and each worker will generate a maximum of 16 outstanding I/Os to each of its disks. The system as a whole will have a maximum of 128 outstanding I/Os at a time (4 workers * 2 disks/worker * 16 outstanding I/Os per disk) from this manager
  • For all Iometer tests, under “Disk Targets” always increase the “# of  Outstanding I/Os” per target.  When left at the default value of ‘1′, a  relative low load will be placed on the array.  By increasing this  number some the OS will queue up multiple requests and really saturate  the storage.  The ideal number of outstanding IOs can be determined by  running the test multiple times and increasing this number all the  while.  At some point IOPS will stop increasing.  Generally an increase  in return diminishes around 16 IOs/target but certainly more than 32  IOs/target will have no value due to the default queue depth in ESX

iometer99

Note: If the total number of outstanding I/Os in the system is very large, Iometer or Windows may hang, thrash, or crash. The exact value of “very large” depends on the disk driver and the amount of physical memory available. This problem is due to limitations in Windows and some disk drivers, and is not a problem with the Iometer software. The problem is seen in Iometer and not in other applications because Iometer makes it easy to specify a number of outstanding I/Os that is much larger than typical applications produce.

  • The Test Connection Rate control specifies how often the worker(s) open and close their disk(s). The default is off, meaning that all the disks are opened at the beginning of the test and are not closed until the end of the test. If you turn this control on, you can specify a number of transactions to perform between opening and closing. (A transaction is an I/O request and the corresponding reply, if any

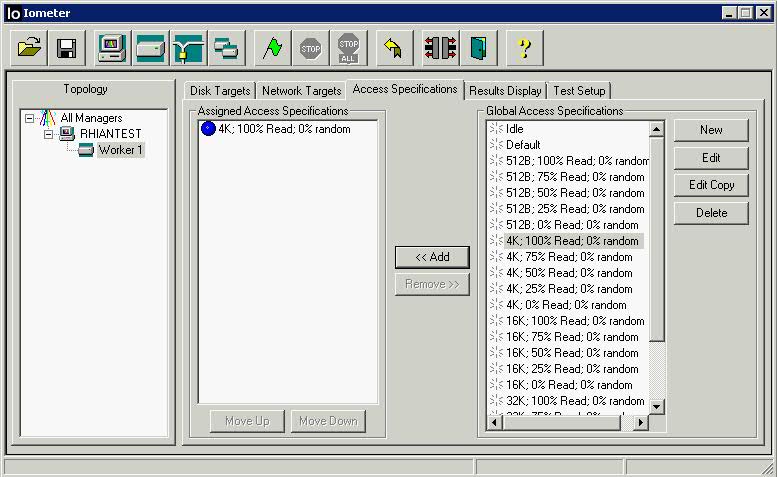
  • Click on Access Specifications
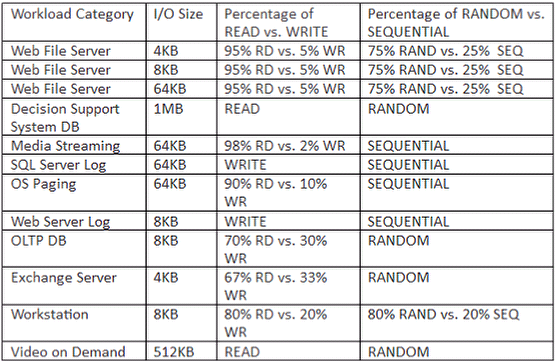
  • Check the table below for recommendations

iometer1

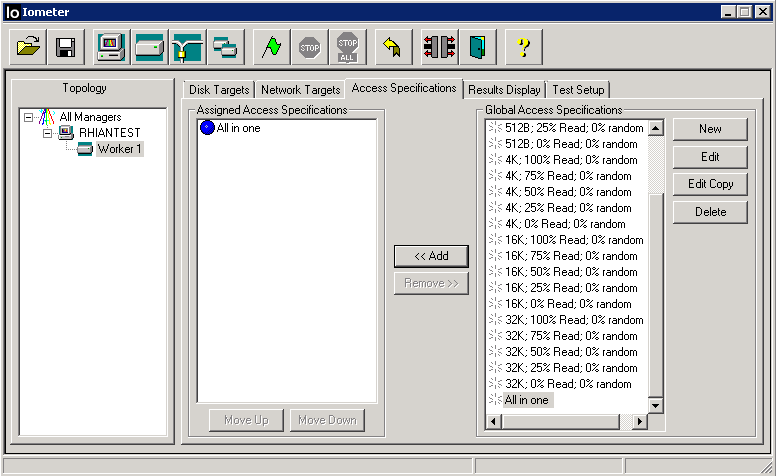
  • Click on Access Specifications.

  • There is an Access Specification called “All in One” spec that’s included with IOmeter. This spec includes all block sizes at varying levels of randomness and can provide a good baseline for server comparison

iometer2

  • You can assign a series of targeted tests that get executed in sequential order under the “Assigned Access Specifications” panel.  You can use existing IO scenarios or define your own custom access scenario. I am going to assign the “4K; 100% Read; 0% Random” specification by selecting it and clicking the “Add” button.  This scenario is self-explanatory, and is generally useful for generating a tremendous amount of IO since your read pattern is optimal and the blocks are small.
  • The default is 2-Kilobyte random I/Os with a mix of 67% reads and 33% writes,
    which represents a typical database workload
  • For maximum throughput (Megabytes per second), try changing the Transfer
    Request Size to 64K, the Percent Read/Write Distribution to 100% Read, and
    the Percent Random/Sequential Distribution to 100% Sequential.
  • For the maximum I/O rate (I/O operations per second), try changing the
    Transfer Request Size to 512 bytes, the Percent Read/Write Distribution to
    100% Read, and the Percent Random/Sequential Distribution to 100%
    Sequential.
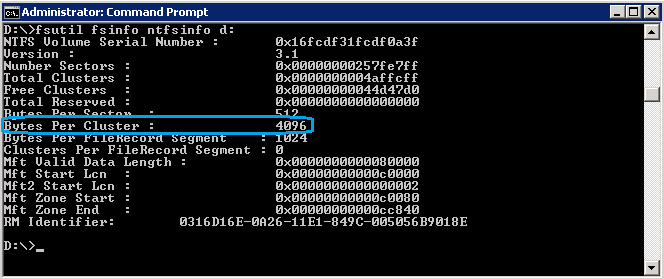
  • If you want to check what block size your O/S is using, try typing the below into a command prompt and look at the value for byes per cluster

blocksize

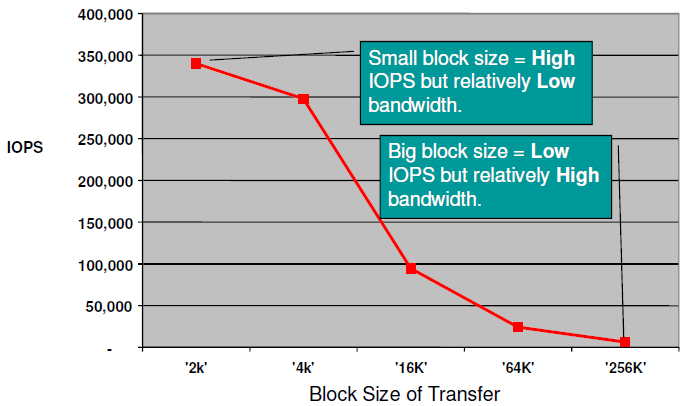
  • Note the below relation between block size and bandwidth

Capture

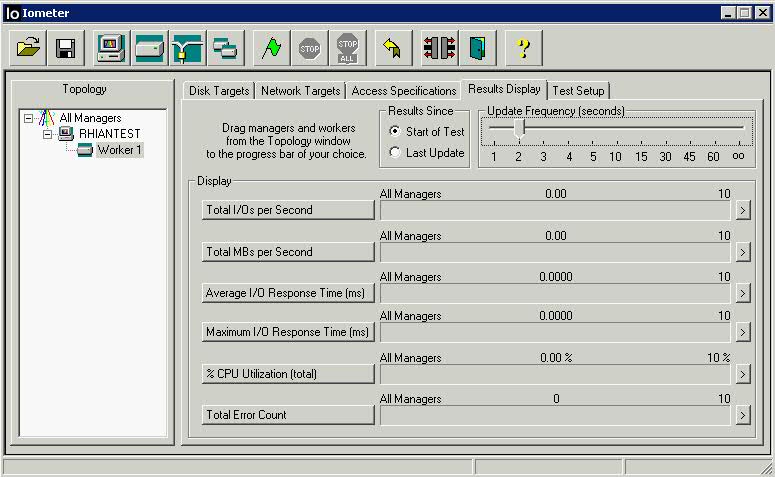
  • Next Click on Results Display

  • This tab will display your test results real-time once the test has finished.  Leave the radio button for “Results Since” set to “Start of Test” as it averages the results as they roll in.
  • Obtaining run-time statistics affects the performance of the system. When running a significant test series, the Update Frequency slider should be set to “oo” (infinity). Also, you should be careful not to move the mouse or to have any background processes (such as a screensaver or FindFast) running while testing, to avoid unnecessary CPU utilization and interrupts.
  • Set the “Update Frequency” to 2 or 3 seconds.  Don’t set it too low as it is possible to affect the test negatively if it is borrowing CPU cycles to keep Iometer updated.  While running you will see activity in the “Display” panel at the frequency you set.
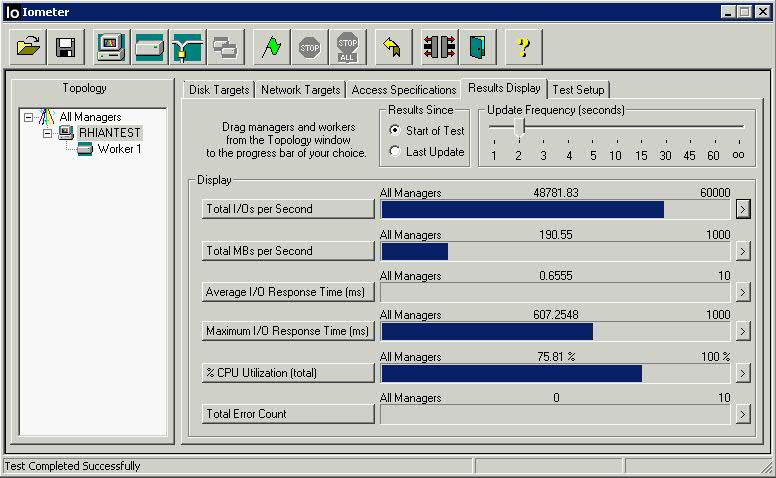
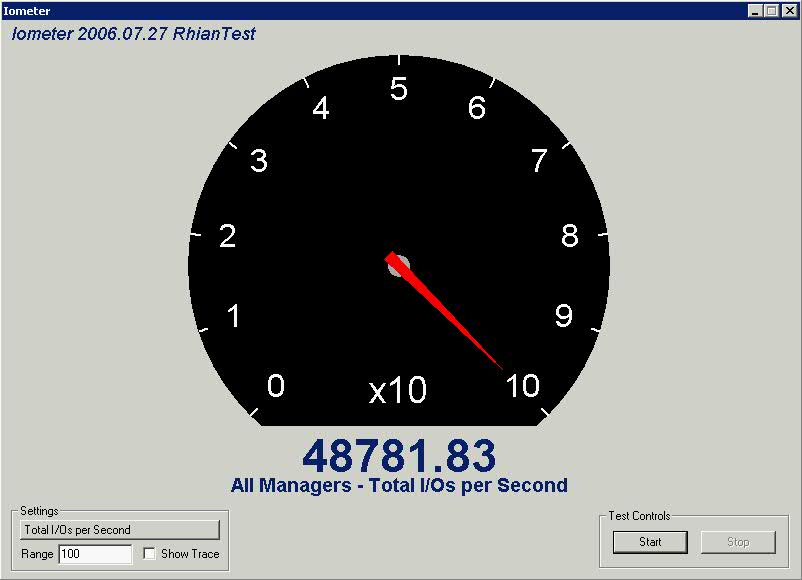
  •  The three most important indicators are “Total I/Os per Second”, “Total MBs per Second”, and “Average I/O Response Time (ms)”.
  • Total I/Os indicate the current number of operations occurring against your storage target.
  • MBs per Second is a function of <I/Os> * <block size>.  This indicates the amount of data your storage target is reading per second.
  • One thing is for certain, that you don’t want to see any errors.  You have another serious issue if that is what you are seeing
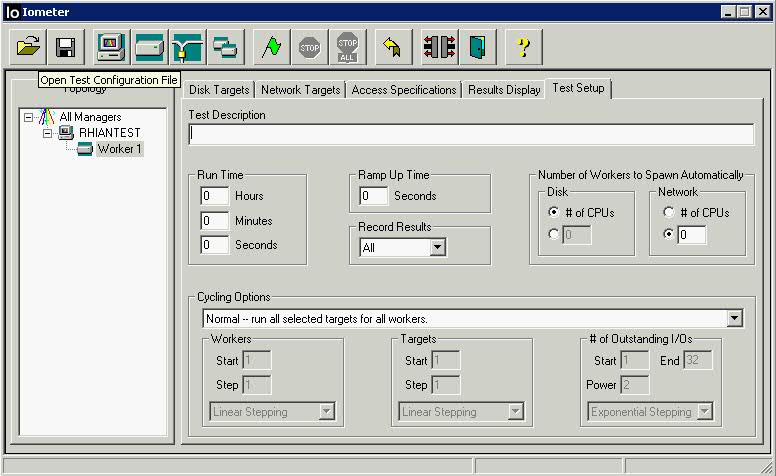
  • Go to Test Setup

  • The “Test Description” is used as an identifier in the output report if you select that option.
  • “Run Time” is something you can adjust.  There are no strict rules regulating this setting.  The longer you run your test the more accurate your results.  You system may have unexpected errors or influences so extending your test a bit will flatten  out any anomalies.  If it is a production test run it for 20 – 60 minutes. There’s all sorts of ram caching whatever going on, so it reports falsely high for a while. If you watch it run, you’ll see it start off reporting very large numbers, and they slowly get smaller, and smaller, and smaller. Don’t pay any attention to the numbers until they stabilize, might be 30+ minutes.
  • “Ramp Up Time” is a useful setting as it allows the disks to spin up and level out the internal cache for a more consistent test result.  Set this between 10 seconds and 1 minute.
  • “Record Results” is used when you would like to produce a test report following the test.  Set it to “None” if you only wish to view the real-time results.  You can accept the defaults for “Number of Workers to Spawn Automatically”.
  • “Cycling Options” gives one the choice to increment Workers, Targets, and Outstanding I/Os while testing.  This is useful in situations where you are uncertain how multiple CPU threads, multiple storage targets, and queue depth effect outcome.  Do experiment with these parameters, especially the Outstanding I/Os (Queue Depth).  Sometimes this is OS dependent and other times it is hardware related.  Remember you can set the “Outstanding I/Os” under the “Disk Targets” tab.  In this test we are going to take the default. the choice to increment Workers, Targets, and Outstanding I/Os while testing.  This is useful in situations where you are uncertain how multiple CPU threads, multiple storage targets, and queue depth effect outcome.
  • Next, now that everything is set, click the Green Flag button at the top to start the test.  Following the Ramp Up time (indicated in the status bar) you will begin to see disk activity

  • It will prompt you to select a location to save your .csv
  • While the tests are running, you will see the below

  • You can expand a particular result into its own screen by pressing the right-arrow at the right of each test, which results in a screen similar to the one shown below

To test network performance between two computers (A and B)

  • On computer A, double-click on Iometer.exe. The Iometer main window appears and a Dynamo workload generator is automatically launched on computer A.
  • On computer B, open an MS-DOS Command Prompt window and execute Dynamo, specifying computer A’s name as a command line argument.
  • For example: C:\> dynamo computer_a
  • On computer A again, note that computer B has appeared as a new manager in the Topology panel. Click on it and note that its disk drives appear in the Disk Targets tab.
  • With computer B selected in the Topology panel, press the Start Network Worker button (picture of network cables). This creates a network server on computer B.
  • With computer B still selected in the Topology panel, switch to the Network Targets tab, which shows the two computers and their network interfaces. Select one of computer A’s network interfaces from the list. This creates a network client on computer A and connects the client and server together.
  • Switch to the Access Specifications tab. Double-click on “Default” in the Global Access Specifications list. In the Edit Access Specification dialog, specify a Transfer Request Size of 512 bytes. Press OK to close the dialog.
  • Switch to the Results Display tab. Set the Update Frequency to 10 seconds.
  • Press the Start Tests button. Select a file to store the test results. If you specify an existing file, the new results will be appended to the existing ones.
  • Watch the results in the Results Display tab.
  • Press the Stop Test button to stop the test and save the results.

Useful Powerpoint Presentation

Texas Systems Storage Presentation

Brilliant Iometer Results Analysis

http://blog.open-e.com/random-vs-sequential-explained/

vSphere 4 Documentation Center

http://pubs.vmware.com/vsphere-4-esx-vcenter/index.jsp

System Volume Information Folder

What is the System Information Volume folder?

The System Information Volume folder contains information that shouldn’t necessarily be interfered with however there are situations where this folder can become extremely large and unmanageable. Below are several bulleted points of possible data which may exist in this folder

  • System Restore points. You can disable System Restore from the “System” control panel.
  • Distributed Link Tracking Service databases for repairing your shortcuts and linked documents.
  • Content Indexing Service databases for fast file searches. This is also the source of the cidaemon.exe process: That is the content indexer itself, busy scanning your files and building its database so you can search for them quickly.
  • Information used by the Volume Snapshot Service (also known as “Volume Shadow Copy”) so you can back up files on a live system.
  • Longhorn systems keep WinFS databases here

The Problem with System Information Folder

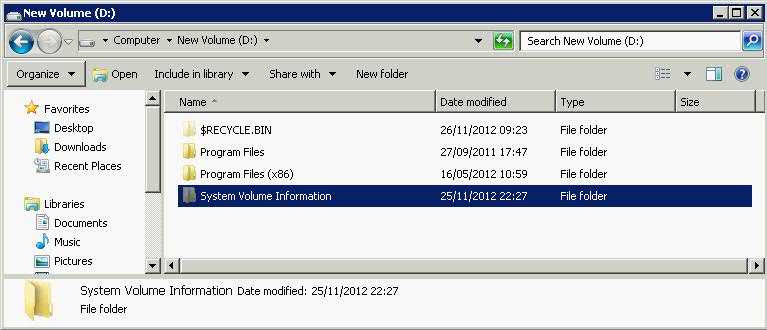
We encountered an issue where on checking this folder on a drive showed it was taking up nearly 80GB space! We opened Folder and Search Options and selected to Show Hidden Files, Folders and Drives and un-ticked Hide Protected Operating System Files to see this folder. Unfortunately you generally cannot access this folder unless you do the following

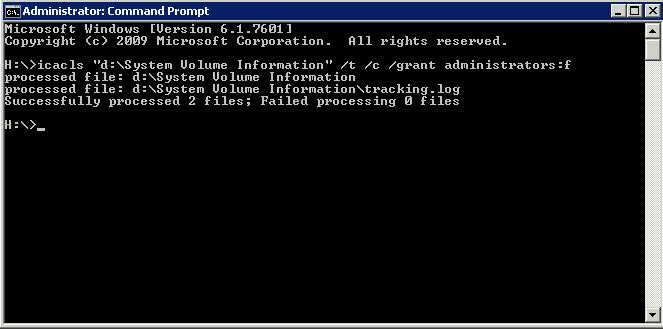
  • Open cmd.exe
  • Type icacls “d:\System Volume Information” /t /c /grant Administrators:f to take ownership of the folder

  • /t = Traverse all folders
  • /c = Continue on file errors (access denied) Error messages are still displayed

Commands to check the space

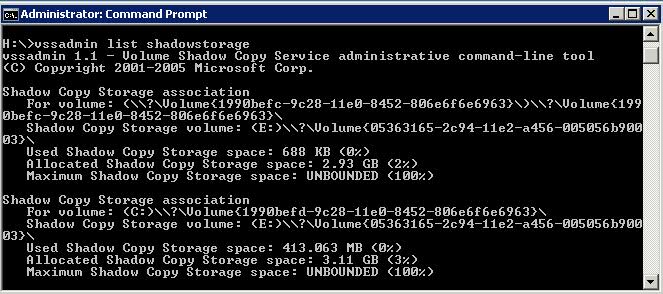
Here are some commands that you could use in the Command Prompt console in administrator mode in order to view and resize the space allocated for the System Volume Information Folder.

  • To View the Storage Space allocated for this folder: Open Command Prompt with “Run as Administrator” option and type the following – vssadmin list shadownstorage

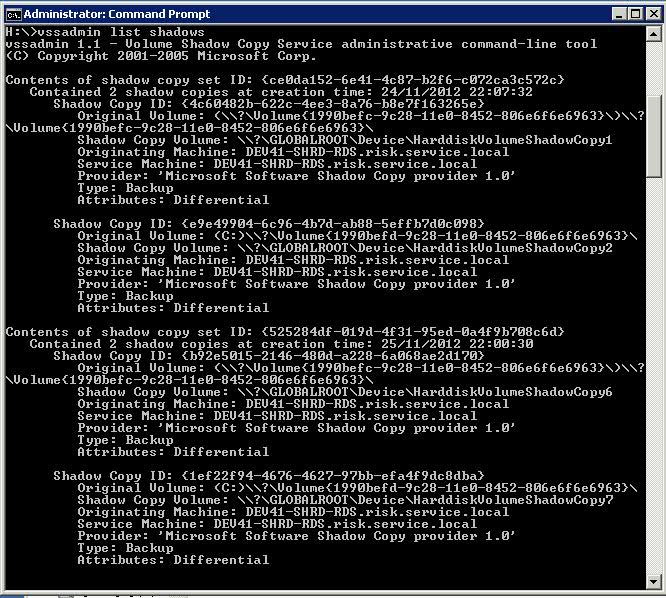
  • To see the restore information stored there: Open Command Prompt with “Run as Administrator” option and type the following – vssadmin list shadows

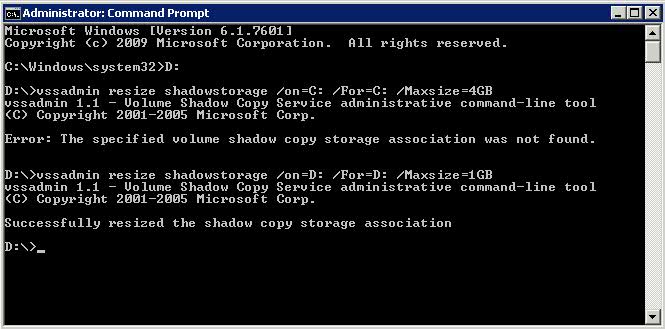
  • To resize the maximum allocated space: Open Command Prompt with “Run as Administrator” option and type the following – vssadmin resize shadowstorage /on=[here add the drive letter]: /For=[here add the drive letter]: /Maxsize=[here add the maximum size]
  •  E.g. vssadmin resize shadowstorage /on=D: /For=D: /Maxsize=4GB

Notes

If the System Information Folder is very large,you may want to check the following

  • Install and Run Treesize which will give you a good insight into what folders you have
  • Check System Restores
  • Check in Disk Management if any of your disks are enabled for Shadow Copies and reduce the amount of disk space these are allowed to take
  • Check DFS Folders
  • Check what your backup software is doing. A high volume of data can sometimes be due to VSS shadow copies not being cleaned up after a VSS capable backup program backs up data on the drive in question.
  • Stop the Microsoft Software Shadow Copy Provider
  • Stop the Volume Shadow Copy Service

How to Problem Solve!

Understanding FSMO Roles in Server 2008

There are five of these FSMO roles in every forest. They are:

  • Schema Master
  • Domain Naming Master
  • Infrastructure Master
  • Relative ID (RID) Master
  • Primary Domain Controller (PDC) Emulator

Two of them are only assigned once in the forest, in the domain at the forest root.

  • Schema Master
  • Domain Naming Master

Three of those FSMO roles are needed once in every domain in the forest:

  • Infrastructure Master
  • Relative ID (RID) Master
  • Primary Domain Controller (PDC) Emulator

Schema Master

Whenever the schema is modified at all, those updates are always completed by the domain controller with the schema master role.  Schema is updated during the normal replication, and the schema updates are replicated throughout all the domains in the forest. It’s advisable to place the schema master role on the same domain controller (DC) as the primary domain controller (PDC) emulator.

Domain Naming Master

This role is not used very often, only when you add/remove any domain controllers. This role ensures that there is a unique name of domain controllers in environments as domains join or leave the forest, the domain naming master makes the updates into active directory.  Only this DC actually commits those changes into the directory.  The domain naming master also commits the changes to application partitions.

Infrastructure Master

This role checks domain for changes to any objects. If any changes are found then it will replicate to another domain controller. The infrastructure master is a translator, between globally unique identifiers (GUIDs), security identifiers (SIDs), and distinguished names (DNs) for foreign domain objects.  If you’ve ever looked at group memberships of a domain local group which has members from other domains, you can sometimes see those users and groups from the other domain listed only by their SID.  The infrastructure master of the domain of which those accounts are in is responsible for translating those from a SID into their name

Usually, you do not put the infrastructure master role on a domain that holds the global catalog.  However, if you’re in a single domain forest, the infrastructure master has no work to do, since there is no translation of foreign principals

Relative ID (RID) Master

This role is responsible for making sure each security principle has a different identifier. The relative ID master, or RID master, hands out batches of relative IDs to individual domain controllers, then each domain controller can use their allotment to create new users, groups, and computers.  When domain controllers need more relative IDs in reserve, they request them from, and are assigned by, the domain controller with the RID master FSMO role.

It is recommended that the RID master FSMO role be assigned to whichever domain controller has the PDC emulator FSMO role

PDC Emulator

The domain controller that has the PDC emulator FSMO role assigned to it has many duties and responsibilities in the domain.  For example, the DC with the PDC emulator role is the DC that updates passwords for users and computers.  When a user attempts to login, and enters a bad password, it’s the DC with the PDC emulator FSMO role that is consulted to determine if the password has been changed without the replica DC’s knowledge. The PDC emulator is also the default domain controller for many administrative tools, and is likewise the default DC used when Group Policies are updated.

Additionally, it’s the PDC emulator which maintains the accurate time that the domain is regulated by.  It’s the time on the PDC emulator which identifies when the last write time for an object was (to resolve conflicts, for example.)  If it’s a forest with multiple domains, then the forest root PDC is the authoritative time source for all domains in the forest.

Each domain in the forest needs its own PDC emulator. Ideally, you put the PDC emulator on the domain controller with the best hardware available.

Seizing of Roles

In case of failures of any server you need to seize the roles. Administrators should use extreme caution in seizing FSMO roles. This operation, in most cases, should be performed only if the original FSMO role owner will not be brought back into the environment.

It is recommended that you log on to the domain controller that you are assigning FSMO roles to. The logged-on user should be a member of the Enterprise Administrators group to transfer schema or domain naming master roles, or a member of the Domain Administrators group of the domain where the PDC emulator, RID master and the Infrastructure master roles are being transferred.

For Schema Master:

  1. Go to cmd prompt and type ntdsutil
  2. Type roles and press enter to enter fsmo maintenance.
  3. To see a list of available commands at any one of the prompts in the Ntdsutil utility, type ? and then press Enter
  4. Type connections to enter server connections.
  5. Type connect to server “Servername” and then press ENTER, where “Servername” is the name of the domain controller you want to assign the FSMO role to
  6. Type quit
  7. Type seize schema master. For a list of roles that you can seize, type ? at the fsmo maintenance prompt, and then press ENTER, or see the list of roles at the start of this article

After you have seized the role, type quit to exit NTDSUtil.

For Domain Naming Master:

Go to cmd prompt and type ntdsutil

  1. Go to cmd prompt and type ntdsutil
  2. Type roles and press enter to enter fsmo maintenance.
  3. To see a list of available commands at any one of the prompts in the Ntdsutil utility, type ? and then press Enter
  4. Type connections to enter server connections.
  5. Type connect to server “Servername” and then press ENTER, where “Servername” is the name of the domain controller you want to assign the FSMO role to
  6. Type quit
  7. Type seize domain naming master.

After you have Seize the role, type quit to exit NTDSUtil.

For Infrastructure Master Role:

Go to cmd prompt and type ntdsutil

  1. Go to cmd prompt and type ntdsutil
  2. Type roles and press enter to enter fsmo maintenance.
  3. To see a list of available commands at any one of the prompts in the Ntdsutil utility, type ? and then press Enter
  4. Type connections to enter server connections.
  5. Type connect to server “Servername” and then press ENTER, where “Servername” is the name of the domain controller you want to assign the FSMO role to
  6. Type quit
  7. Type seize infrastructure master.

After you have Seize the role, type quit to exit NTDSUtil.

For RID Master Role:

Go to cmd prompt and type ntdsutil

  1. Go to cmd prompt and type ntdsutil
  2. Type roles and press enter to enter fsmo maintenance.
  3. To see a list of available commands at any one of the prompts in the Ntdsutil utility, type ? and then press Enter
  4. Type connections to enter server connections.
  5. Type connect to server “Servername” and then press ENTER, where “Servername” is the name of the domain controller you want to assign the FSMO role to
  6. Type quit
  7. Type seize RID master.

After you have Seize the role, type quit to exit NTDSUtil.

For PDC Emulator Role:

Go to cmd prompt and type ntdsutil

  1. Go to cmd prompt and type ntdsutil
  2. Type roles and press enter to enter fsmo maintenance.
  3. To see a list of available commands at any one of the prompts in the Ntdsutil utility, type ? and then press Enter
  4. Type connections to enter server connections.
  5. Type connect to server “Servername” and then press ENTER, where “Servername” is the name of the domain controller you want to assign the FSMO role to
  6. Type quit
  7. Type seize PDC.

After you have Seize the role, type quit to exit NTDSUtil

How can I determine who are the current FSMO Roles holders in my domain/forest?

  • On any domain controller, click Start, click Run, type ntdsutil in the Open box, and then click OK.
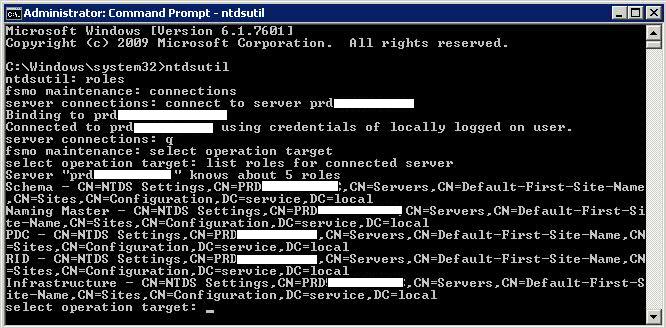
The FSMO role holders can be easily found by use of some of the AD snap-ins. Use this table to see which tool can be used for what FSMO role:

Using multiple SCSI Controllers within VMware

VMware highly recommends using multiple virtual SCSI controllers for the database virtual machines or virtual machines with high I/O load. The use of multiple virtual SCSI controllers allows the execution of several parallel I/O operations inside the guest operating systemVMware also highly recommends separating the Redo/Log I/O traffic from the data file I/O traffic through separate virtual SCSI controllers. As a best practice, you can use one controller for the operating system and swap, another controller for DB Log, and one or more additional controllers for database data files (depending on the number and size of the Database files)

Limits

  • 4 x SCSI Controllers
  • 15 Disks per SCSI Controller

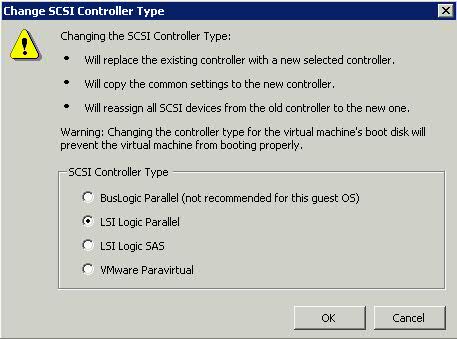
SCSI Controllers

BusLogic Parallel

  •  Older guest operating systems default to the BusLogic adapter.
  • Considered Legacy

LSI Logic Parallel

  • The LSI Logic Parallel adapter and the LSI Logic SAS adapter offer equivalent performance. Some guest operating system vendors are phasing our support for Parallel SCSI in favor of SAS, so if your virtual machine and guest operating system support SAS, choose LSI SAS to maintain future compatibility

LSI Logic SAS

  • LSI Logic SAS is available only for virtual machines with hardware version 7

VMware Paravirtual

  • Paravirtual SCSI (PVSCSI) controllers are high performance storage controllers that can result in greater throughput and lower CPU use. PVSCSI controllers are best suited for high-performance storage environments.
  • PVSCSI controllers are available for virtual machines running hardware version 7 and later.
  • PVSCSI only supports the following guest OS’s – Windows 2003, Windows 2008 and Red Hat Enterprise Linux 5.
  • Hot add or remove requires a bus rescan from within the guest operating system.
  • Disks on PVSCSI controllers might not experience performance gains if they have snapshots or if memory on the ESXi host is over committed
  • SCS clusters are not supported.
  • PVSCSI controllers do not support boot disks, the disk that contains the system software, on Red Hat Linux 5 virtual machines. Attach the boot disk to the virtual machine by using any of the other supported controller typeS

Do I choose the PVSCSI or LSI Logic virtual adapter on ESX 4.0 for non-IO intensive workloads?

VMware evaluated the performance of PVSCSI and LSI Logic to provide a guideline to customers on choosing the right adapter for different workloads. The experiment results show that PVSCSI greatly improves the CPU efficiency and provides better throughput for heavy I/O workloads. For certain workloads, however, the ESX 4.0 implementation of PVSCSI may have a higher latency than LSI Logic if the workload drives low I/O rates or issues few outstanding I/Os. This is due to the way the PVSCSI driver handles interrupt coalescing.One technique for storage driver efficiency improvements is interrupt coalescing. Coalescing can be thought of as buffering: multiple events are queued for simultaneous processing. For coalescing to improve efficiency, interrupts must stream in fast enough to create large batch requests. Otherwise, the timeout window will pass with no additional interrupts arriving. This means the single interrupt is handled as normal but after an unnecessary delay.The behavior of two key storage counters affects the way the PVSCSI and LSI Logic adapters handle interrupt coalescing:

  • Outstanding I/Os (OIOs): Represents the virtual machine’s demand for I/O.
  • I/Os per second (IOPS): Represents the storage system’s supply of I/O.

The LSI Logic driver increases coalescing as OIOs and IOPS increase. No coalescing is used with few OIOs or low throughput. This produces efficient I/O at large throughput and low-latency I/O when throughput is small.

In ESX 4.0, the PVSCSI driver coalesces based on OIOs only, and not throughput. This means that when the virtual machine is requesting a lot of I/O but the storage is not delivering, the PVSCSI driver is coalescing interrupts. But without the storage supplying a steady stream of I/Os, there are no interrupts to coalesce. The result is a slightly increased latency with little or no efficiency gain for PVSCSI in low throughput environments.
The CPU utilization difference between LSI and PVSCSI at hundreds of IOPS is insignificant. But at larger numbers of IOPS, PVSCSI can save a lot of CPU cycles

The test results show that PVSCSI is better than LSI Logic, except under one condition–the virtual machine is performing less than 2,000 IOPS and issuing greater than 4 outstanding I/Os. This issue is fixed in vSphere 4.1, so that the PVSCSI virtual adapter can be used with good performance, even under this condition.

Changing queue depths

http://kb.vmware.com

http://pubs.vmware.com/vsphere-50

Useful Article by Scott Lowe

http://www.virtualizationadmin.com/articles-tutorials/general-virtualization-articles/vmwares-paravirtual-scsi-adapter-benefits-watch-outs-usage.html

Active Directory Time Synchronisation

What is Time Synchronisation?

Time synchronization is an important feature for all computers on the network. By default, the clients computers get their time from a Domain Controller and the Domain Controller gets his time from the domain’s PDC Operation Master. The PDC must synchronize their time from a reliable external time source.

Windows Server includes W32Time, the Time Service tool that is required by the Kerberos authentication protocol. The Windows Time service makes sure that all computers in an organization that are running the Microsoft Windows Server operating system or later versions use a common time.

Basic Operation of the Windows Time Service

http://support.microsoft.com/kb/224799

Pre Requisites

You will need to open the default UDP 123 port (inbound and outbound) on your corporate firewall to allow time synchronisation

What external time servers can I use?

http://www.pool.ntp.org/en/use.html

Instructions

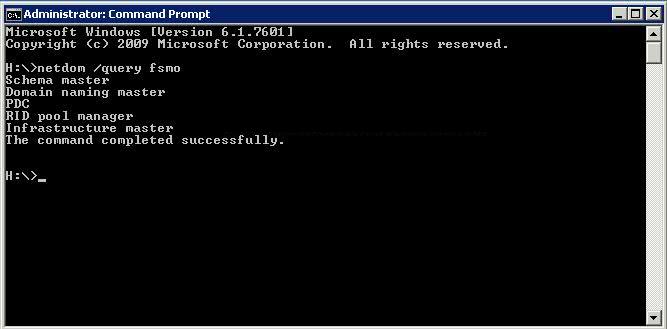
  • First you need to find your PDC Server. Open the Command Prompt and type netdom /query fsmo. Our servers have been blanked out below but you will see your servers listed

  • Log on to your PDC and stop the W32Time Service. Type net stop w32time
  • Configure the external time source

  • Make your PDC a reliable time source for the clients. Type w32tm /config /reliable:yes
  • Type w32tm /config update
  • Type w32tm /config resync
  • Type net start w32time
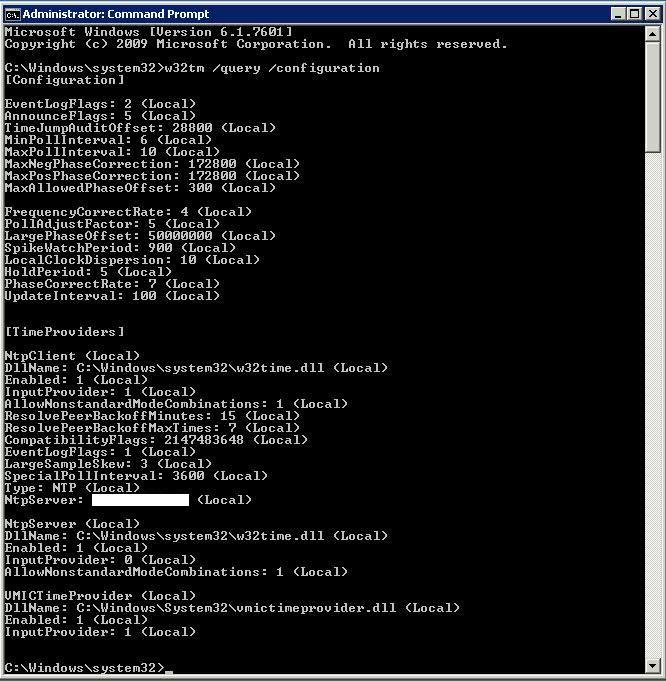
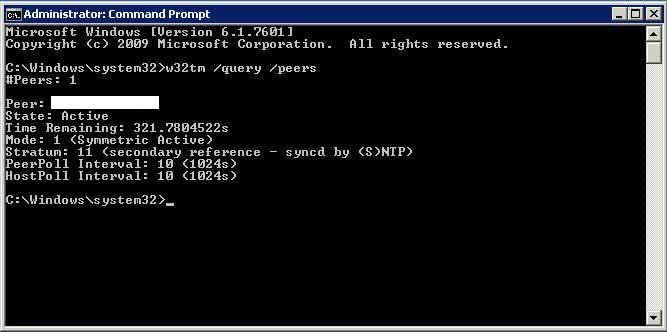
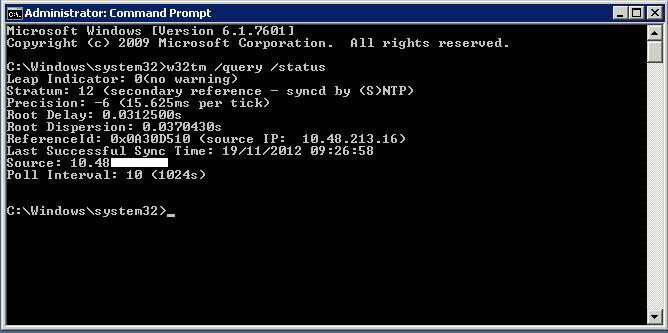
  • The Windows Time Service should begin synchronizing the time. You can check the external NTP servers in the time configuration by typing the following commands

w32tm /query /configuration

w32tm /query /peers

w32tm /query /status

  • Check the Event Viewer for any errors.

SCSI-3 Persistent Reservations in Windows Clustering

What is a “Persistent Reservation” (PR)?

A PR is a SCSI command, which clustering uses to protect LUN’s. When a LUN is reserved, no other computers on the SAN can access the disk, except the ones cluster controls. This is important to protect other machines from accessing the disk and corrupting the data on the disk.

Validate a Cluster Configuration is a functional test tool that verifies that your storage supports all the necessary SCSI commands that clustering requires. It is critical that Validate tests pass, for your cluster to work correctly. The Storage tests are by far the most important, they should not be dismissed!

This test validates that the cluster storage uses the more recent (SCSI-3 standard) Persistent Reserve commands (which are different from the older SCSI-2 standard reserve/release commands). The Persistent Reserve commands avoid SCSI bus resets, which means they are much less disruptive than the older reserve/release commands. Therefore, a failover cluster can be more responsive in a variety of situations, as compared to a cluster running an earlier version of the operating system. In addition, disks are never left in an unprotected state, which lowers the risk of volume corruption

SQL Server 2008 Clustering

This post follows on from the previous post regarding the setup of Microsoft Windows Clusters which will be required before you can set up Microsoft SQL Clustering

Pre Requisites

  • You must have installed Microsoft .NET Framework on both nodes in the cluster – On the Windows Server, you can go to Add Features and select Microsoft .NET 3.5 SP1
  • Create all necessary SQL Server Active Directory Groups for the relevant SQL Server Services (SQL Agent, DB Agent, Analysis Services) Note that Reporting Services/Integration Services are not cluster aware but you can install it to be used with just this server
  • Make sure all patching and software updates are current
  • You must be running Microsoft Enterprise/Datacenter edition
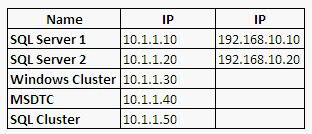
  • Please see the table below for an example of the amount of NICs and different subnets required for a 2 Node Windows/SQL Cluster

Number of Nodes supported by SQL Server versions

Instructions for Node 1

  • On Node 1, connect the SQL Server 2005/2008 ISO or installer
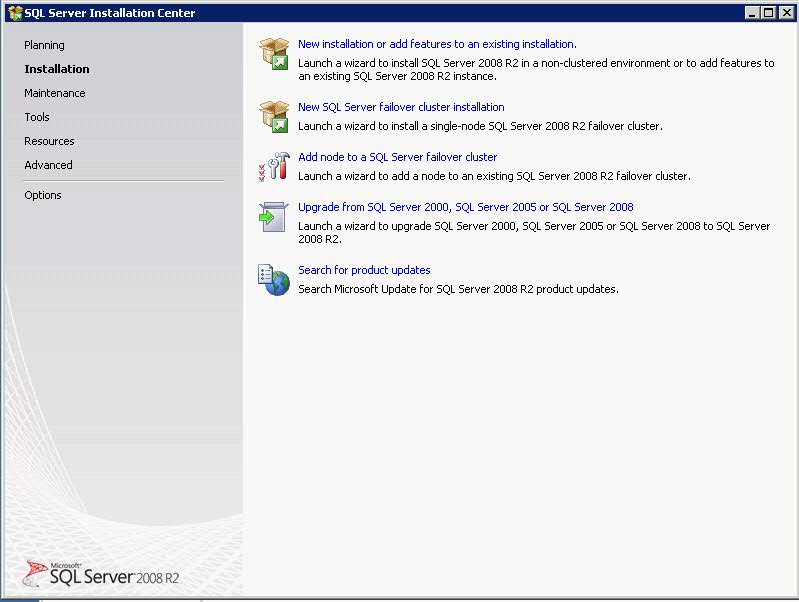
  • Click Setup and choose New SQL Server Failover Cluster Installation

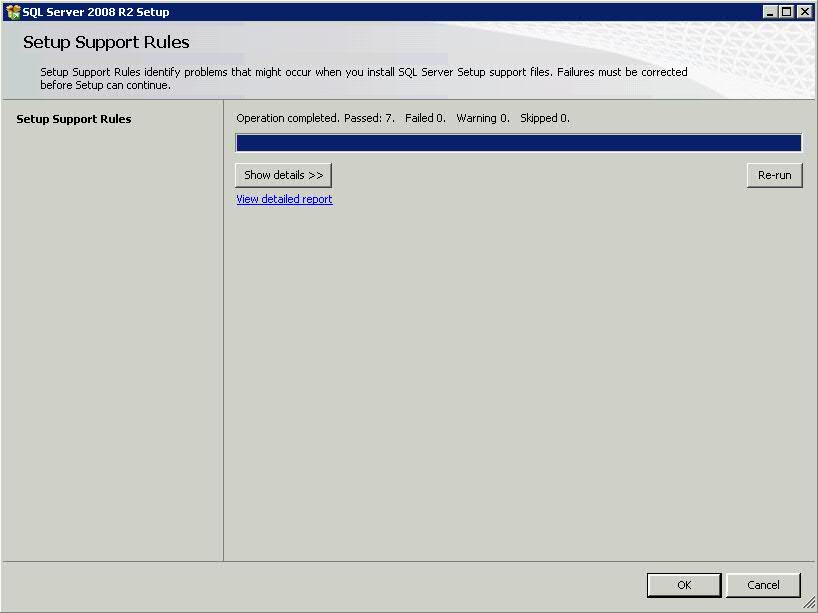
  • Select to Install Setup Support Rules

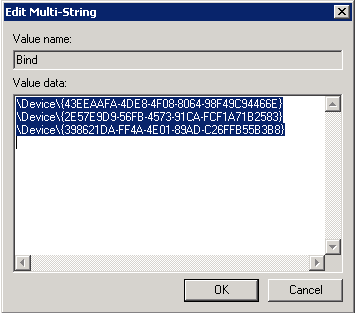
  • If you get a Network Binding error and your bindings all look correct with the LAN NIC at the top correctly then please try modifying the registry. It looks like sometimes the system takes the Virtual Cluster adapter to be the top binding but this is not visible from Network Connections Window when you go into Advanced settings
  • Drill down to HKEY_LOCAL_MACHINE\SYSTEM\CurrentControlSet\services\Tcpip\Linkage and open up the Bind value and move the LAN ID to the top

  • Setup Support Files
  • Select Product Key
  • On Feature, Select Database Engine Services, Replication Services and Analysis Services
  • Note that Reporting Services/Integration Services are not cluster aware but you can install it to be used with just this server
  • On Instance Configuration, you need to enter a SQL Server Network Name like SQLCLUSTER
  • Keep the default instance or choose a new instance
  • You can change the Instance Root Directory if you wish also *NEED TO CHECK THIS
  • Click Next
  • On the Cluster Resource Group, you can keep the settings
  • In the Cluster Disk Selection, Select the disks you want to use for SQL DB and SQL Logs (Make sure both are ticked!!!)
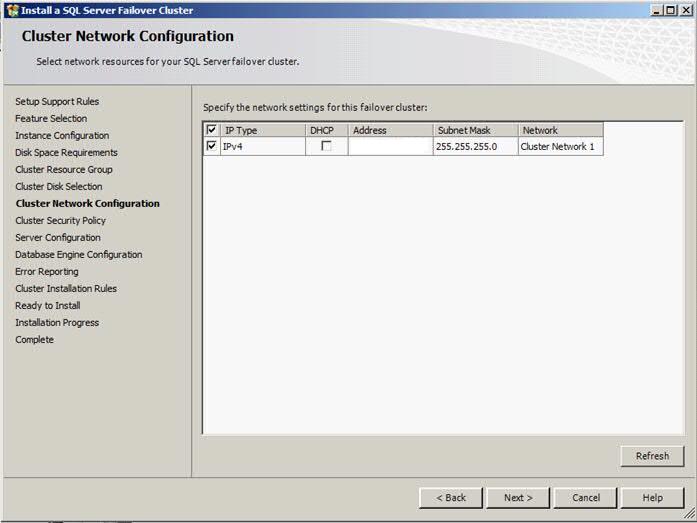
  • Next the Cluster Network Configuration

  • Untick DHCP and provide a new IP Address and Subnet
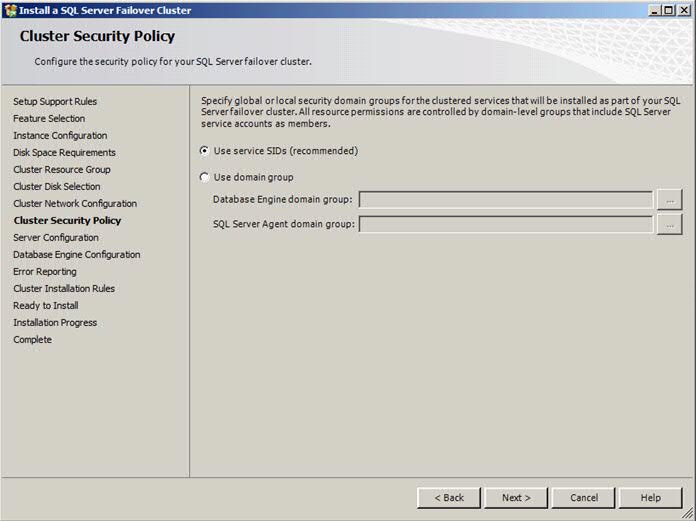
  • On Cluster Security Policy, keep Use Service SSIDs

  • On Service Accounts, please fill in the AD accounts you previously created for SQL Server Agent and SQL Server DB Engine
  • Check Collation is as you want it – Usually Latin1_General_C1_AS
  • In Database Engine Configuration, select Mixed mode and add a password for sa and add the current user
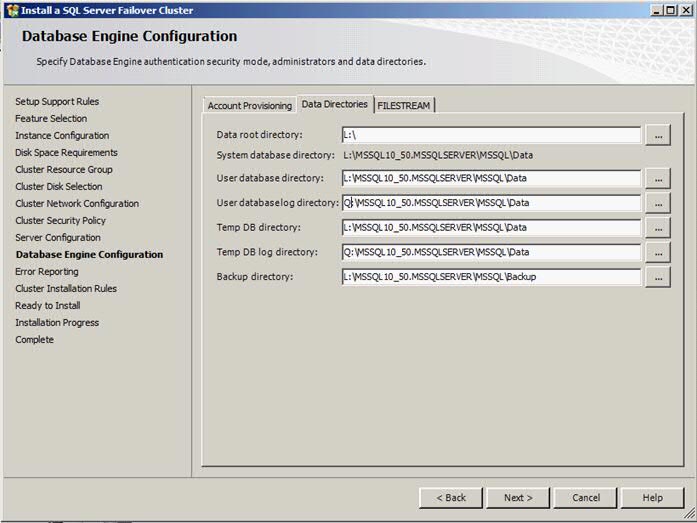
  • Click the Data Directories Tab and configure these paths as appropriate

  • Enable Filestream if you want
  • On Error and Usage Configuration
  • Next
  • Next
  • Install

Instructions for Node 2

  • Choose Add Node to a SQL Server Failover Cluster

  • Next
  • Put in Product Key
  • Accept Licensing
  • Install Setup Support Files
  • Check Setup Support Rules
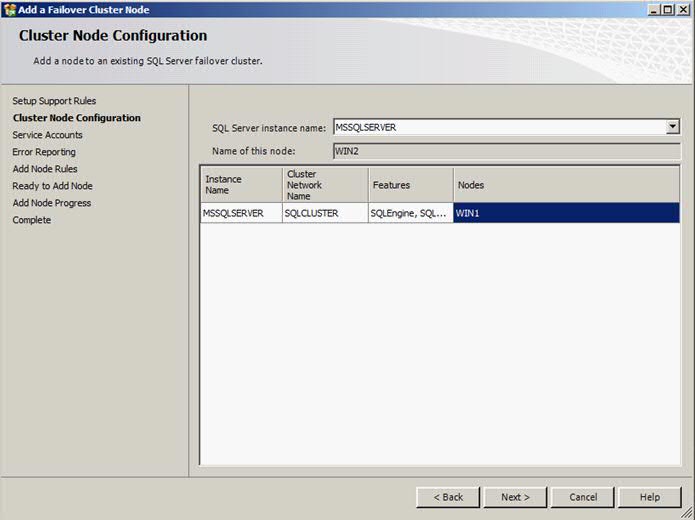
  • On the Cluster Node Configuration, check this is all correct

  • Enter password for SQL Server Engine and SQL Server Agent account
  • Click Next on Error Reporting
  • Click Next on Add Node Rules
  • Click Install
  • Complete and Close

Testing Failover

  • Log into the SQL Server and open SQL Management Studio. Test a query against your DB
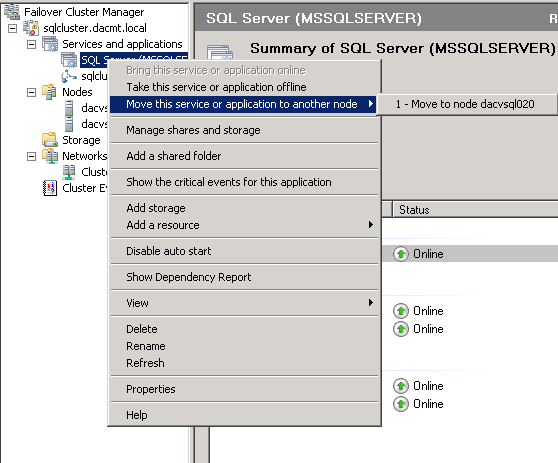
  • Open Failover Cluster Manager
  • Go to Services and Applications
  • Click on SQL Server (Cluster Name)

  • Select Move this Application or Service to another node.
  • Once this has transferred, do the same query test on the second server and make sure everything works as expected.
  • If so then Failover is working correctly
  • Go to vCenter and create a new HA rule keeping these DB Servers running on separate hosts for the ultimate in failover 🙂

Note: If you find you want to clear the Event Logs post Installation and have a fresh start, then you will need to clear the logs from both servers then close Failover Cluster Manager and restart it.
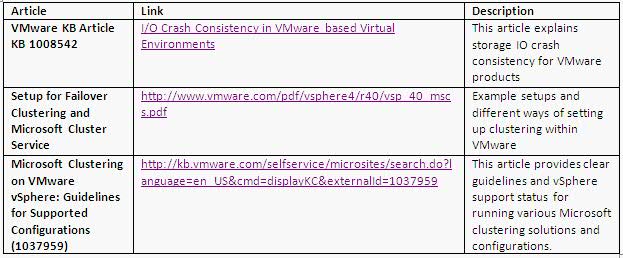
Useful Articles

capture