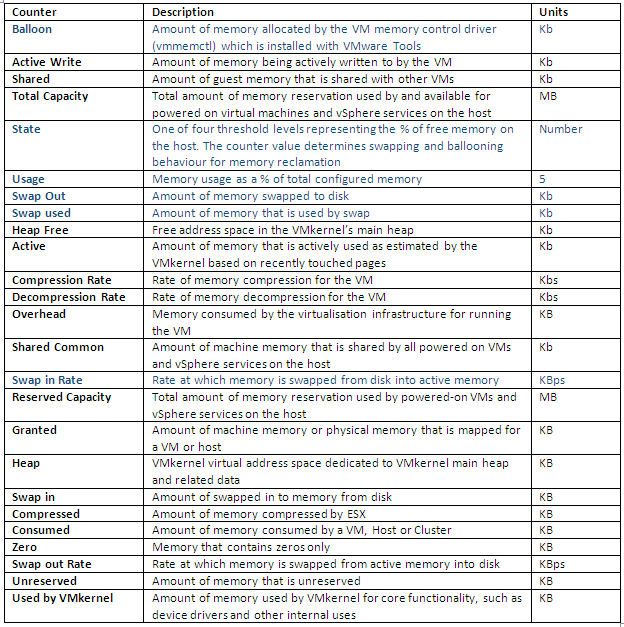
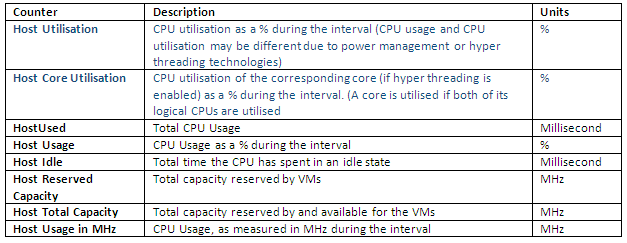
Use the vSphere vCenter Performance Charts to monitor Memory usage and CPU usage of clusters, hosts, virtual machines, and vApps. Really useful statistics in blue
Host Memory
VM Memory
Host CPU
VM CPU

| M | T | W | T | F | S | S |
|---|---|---|---|---|---|---|
| 1 | 2 | |||||
| 3 | 4 | 5 | 6 | 7 | 8 | 9 |
| 10 | 11 | 12 | 13 | 14 | 15 | 16 |
| 17 | 18 | 19 | 20 | 21 | 22 | 23 |
| 24 | 25 | 26 | 27 | 28 | 29 | 30 |
| 31 | ||||||


