Archive for VMware

PowerCLI Poster 4.0 and 5.0

Poster of PowerCLI commands for VMware 4.0 +

http://communities.vmware.com/servlet/JiveServlet/download/1597600-42488/PowerCLI-Poster-4.1.pdf;jsessionid=2765C5954C484E4EA249B1702441E330

Poster of PowerCLI commands for VMware 5.0

http://communities.vmware.com/servlet/JiveServlet/download/1821950-70918/VMware%20Management%20with%20PowerCLI%205.0.pdf

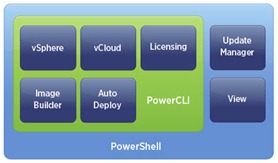
The new poster adds to the original vSphere PowerCLI core cmdlets and allow you to quickly reference cmdlets from the following :

  • vSphere
  • Image Builder
  • Auto Deploy
  • Update Manager
  • Licensing
  • View
  • vCloud

Autolab (VMware Tool)

Courtesy of labguides.com – Check it Out!

What is the AutoLab?

The AutoLab is a quick easy way to build a vSphere environment for testing and learning using a single desktop or laptop PC and VMware Workstation, Fusion or ESXi. The whole lab runs in VMs on that one PC, even ESXi runs in a VM and can then run it’s own VMs.

What’s in the AutoLab?

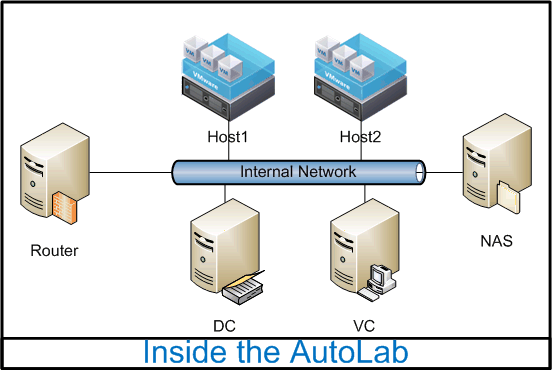
The Autolab download contains a set of shell VMs and a lot of automation.  Once built the lab contains two ESXi servers, a Windows Domain controller, a Windows Virtual Centre, a FreeNAS storage appliance and a FreeSCO Router to link it to the outside world

What can I do with the AutoLab?

  • Run VMs on the lab ESXi servers, using iSCSI shared storage
  • Build an HA and DRS cluster
  • Work with vSphere Networking
  • Practice the upgrade from vSphere 4.1 to vSphere 5.0
  • Use PowerShell and the VCLI to manage the lab
  • Rebuild the whole lab quickly and with minimal effort
  • Choose how much automation you want in the lab build
  • Take the lab with you on your laptop

Hardware Requirements

Will my laptop/PC be able to run the AutoLab?

If your laptop has 8GB of RAM and a recent CPU you should be able to run the lab. Here is my three year old laptop that is upgraded to 8GB of RAM running the whole lab including VMs running on the ESXi servers inside the lab.

Where can I get the AutoLab?

http://www.labguides.com/autolab/

vBrownBags

vBrownBags are a series of online webinars held using GotoMeeting and covering various Virtualization & VMware Certification topics.

http://professionalvmware.com/brownbags/

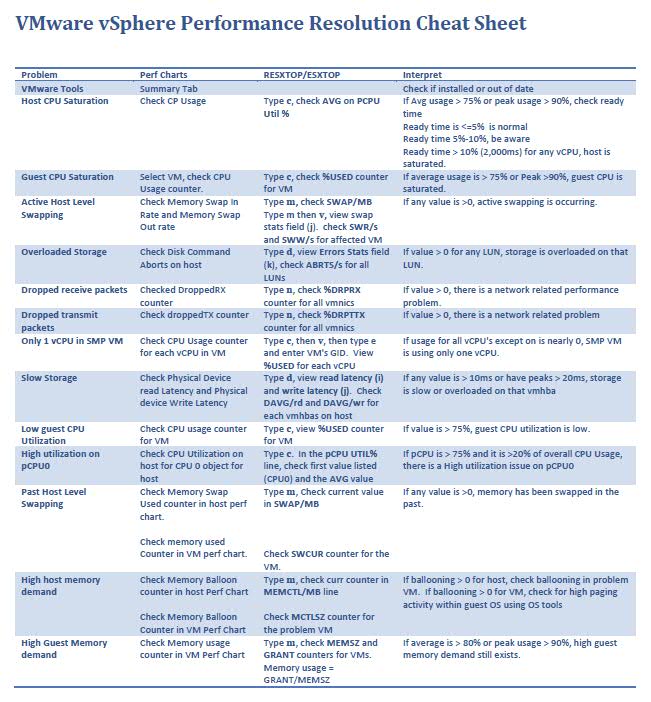
VMware vSphere Performance Resolution Cheat Sheet

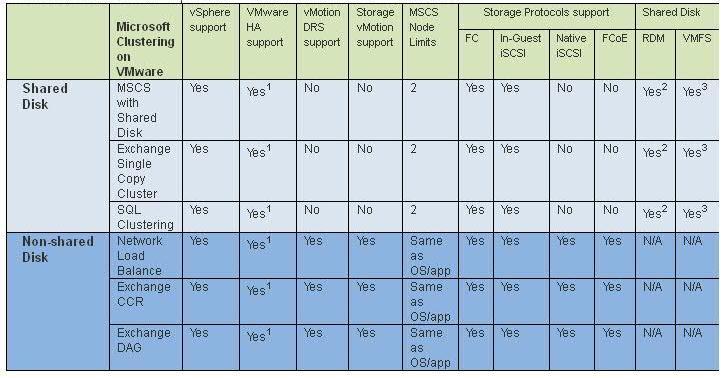
VMware vSphere support for Microsoft clustering solutions on VMware

Links

http://kb.vmware.com/selfservice/microsites/search.do?language=en_US&cmd=displayKC&externalId=1037959

https://www.vmware.com/pdf/vsphere4/r41/vsp_41_mscs.pdf

VMware VMDK Files

VMDK Files

These are the disk files that are created for each virtual hard drive in your VM. There are 3 different types of files that use the vmdk extension, they are:

  • *–flat.vmdk file – This is the actual raw disk file that is created for each virtual hard drive. Almost all of a .vmdk file’s content is the virtual machine’s data, with a small portion allotted to virtual machine overhead. This file will be roughly the same size as your virtual hard drive.
  • *.vmdk file – This isn’t the file containing the raw data anymore. Instead it is the disk descriptor file which describes the size and geometry of the virtual disk file. This file is in text format and contains the name of the –flat.vmdk file for which it is associated with and also the hard drive adapter type, drive sectors, heads and cylinders, etc. One of these files will exist for each virtual hard drive that is assigned to your virtual machine. You can tell which –flat.vmdk file it is associated with by opening the file and looking at the Extent Description field.
  • *–delta.vmdk file – This is the differential file created when you take a snapshot of a VM (also known as REDO log). When you snapshot a VM it stops writing to the base vmdk and starts writing changes to the snapshot delta file. The snapshot delta will initially be small and then start growing as changes are made to the base vmdk file, The delta file is a bitmap of the changes to the base vmdk thus is can never grow larger than the base vmdk. A delta file will be created for each snapshot that you create for a VM. These files are automatically deleted when the snapshot is deleted or reverted in snapshot manage

Storage/Datastore Reclamation in VMware

Sometimes, it is worth doing a storage reclamation exercise through all your VMware Datastores in order to remove old folder, files and to check that nothing miscellaneous is going on.

What can you find?

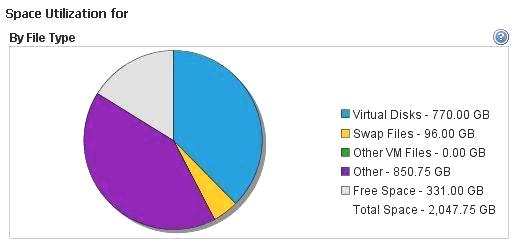
In vCenter > Datastores > Performance Tab, you can find the graph showing all the files it can detect with the selection “Other VM Files” OR “Other” which is what we’re interested in.

When we checked this out on the Host back-end logged in via Putty, we can see the below. The ./ files are not usual to find on LUNs/Datstores and indicate that there are SAN snapshots existing on here

/vmfs/volumes/4e0da454-902c23bf-cb36-e61f13f7c69b # ls -l

SERVER01
SERVER02
SERVER03

/vmfs/volumes/4e0da454-902c23bf-cb36-e61f13f7c69b # find . -exec ls -lh {} \; | grep flat

SERVER01-flat.vmdk
SERVER01_1-flat.vmdk
SERVER01_2-flat.vmdk
SERVER01_3-flat.vmdk

./SERVER01/SERVER01_3-flat.vmdk
./SERVER01/SERVER01_2-flat.vmdk
./SERVER01/SERVER01_1-flat.vmdk
./SERVER01/SERVER01-flat.vmdk

Conclusion

You will need to ask your Storage Admin to check out your LUNs and make sure that any old snapshots are either required or can be deleted.

It is worth keeping an eye on all of this as we found we had nearly 2TB of LUN Snapshots lurking around taking up valuable and expensive storage space.

Storage I/O Control

What is Storage I/ Control?

*VMware Enterprise Plus License Feature

Set an equal baseline and then define priority access to storage resources according to established business rules. Storage I/O Control enables a pre-programmed response to occur when access to a storage resource becomes contentious

With VMware Storage I/O Control, you can configure rules and policies to specify the business priority of each VM. When I/O congestion is detected, Storage I/O Control dynamically allocates the available I/O resources to VMs according to your rules, enabling you to:

  • Improve service levels for critical applications
  • Virtualize more types of workloads, including I/O-intensive business-critical applications
  • Ensure that each cloud tenant gets their fair share of I/O resources
  • Increase administrator productivity by reducing amount of active performance management required.
  • Increase flexibility and agility of your infrastructure by reducing your need for storage volumes dedicated to a single application

How is it configured?

It’s quite straight forward to do. First you have to enable it on the datastores. Only if you want to prioritize a certain VM’s I/Os do you need to do additional configuration steps such as setting shares on a per VM basis. Yes, this can be a bit tedious if you have very many VMs that you want to change from the default shares value. But this only needs to be done once, and after that SIOC is up and running without any additional tweaking needed
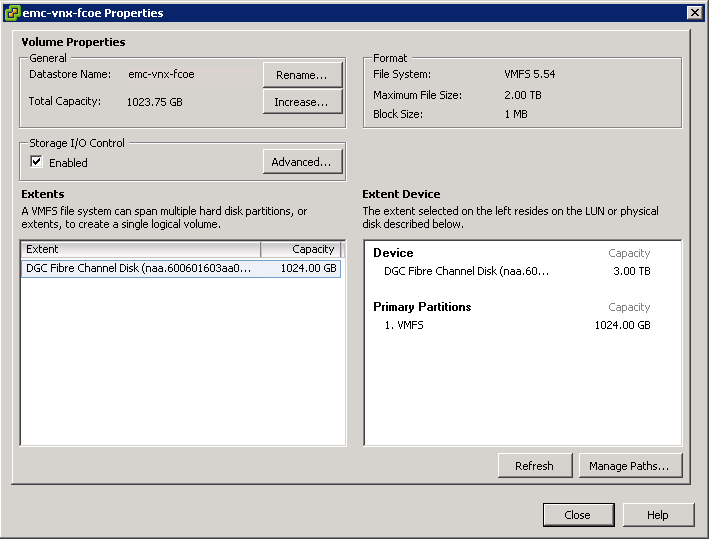
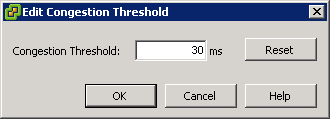
The shares mechanism is triggered when the latency to a particular datastore rises above the pre-defined latency threshold seen earlier. Note that the latency is calculated cluster-wide. Storage I/O Control also allows one to tune &  place a maximum on the number of IOPS that a particular VM can generate  to a shared datastore. The Shares and IOPS values are configured on a per VM basis. Edit the Settings of the VM, select the Resource tab, and the Disk setting will allow you to set the Shares value for when contention arises (set to Normal/1000 by default), and limit the IOPs that the VM can generate on the datastore (set to Unlimited by default):

Why enable it?

The thing is, without SIOC, you could definitely hit this noisy neighbour problem where one VM could use more than its fair share of resources and impact other VMs residing on the same datastore. So by simply enabling SIOC on that datastore, the algorithms will ensure fairness across all VMs sharing the same datastore as they will all have the same number of shares by default. This is a great reason for admins to use this feature when it is available to them. And another cool feature is that once SIOC is enabled, there are additional performance counters available to you which you typically don’t have

What threshold should you set?

30ms is an appropriate threshold for most applications however you may want to have a discussion with your storage array vendor, as they often make recommendations around latency threshold values for SIOC

Problems

One reason that this can occur is when the back-end disks/spindles have other LUNs built on them, and these LUNs are presented to non ESXi hosts. Check out

KB 1020651 for details on how to address this and previous posts

and

http://www.electricmonk.org.uk/2012/04/20/external-io-workload-detected-on-shared-datastore-running-storage-io-control-sioc/
Managing Processor use for Virtual Environments

General Rules for Processor Scheduling

  1. ESX(i) schedules VMs onto and off of processors as needed
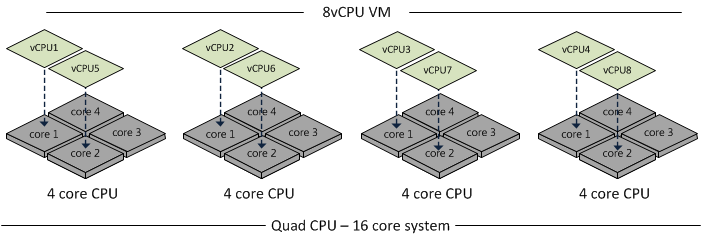
  2. Whenever a VM is scheduled to a processor, all of the cores must be available for the VM to be scheduled or the VM cannot be scheduled at all
  3. If a VM cannot be scheduled to a prcoessor when it needs access, VM performance can suffer a great deal.
  4. When VMs are ready for a processor but are unable to be scheduled, this creates what VMware calls the CPU %Ready values
  5. CPU %Ready manifests itself as a utilisation issue but is actually a scheduling issue
  6. VMware attempts to schedule VMs on the same core over and over again and sometimes it has to move to another processor. Processor caches contain certain information that allows the OS to perform better. If the VM is actually moved across sockets and the cache isn’t shared, then it needs to be loaded with this new info.
  7. Maintain consistent Guest OS configurations

Scheduling Issues

  1. Mixing Single, dual and quad core vCPUs VMs on the same ESX(i) server can create major scheduling problems. This is especially true when the ESX Server has low core densities or when the ESX servers average moderate to high utilisation levels
  2. Where possible reduce VMs to single vCPU VMs except if they host an application which requires multiple CPUs or if you find reducing on to one core is not possible to due to high utilisation on both cores on that particular VM
  3. Keep an eye on scheduling issues especially CPU% Ready. More than 2% indicates processor scheduling issues

Performance enhancers for vSphere

  1. Non scheduling of idle processors

vSphere has the ability to skip scheduling of idle processors. For example if a quad processor VM has activity on only 1 core, vSphere has the ability to schedule only that single core sometimes. A multi threaded app will likely be using most or all of its cores most of the time. If a VM has CPUs that are sitting idle a lot, it should be reviewed whether this VM actually needs the multiple processors

If your application is not multi-threaded, you gain nothing by adding cores to the VM and make it more difficult to schedule

2.  Processor Skew

Guest OSs expect to see progress on all of their cores all of the time. vSphere has the ability to allow a small amount of skew whereby the processors need not be completely in sync but this has to be kept within reasonable limits

For a detailed description of how ESX(i) schedules VMs to processors please read

http://www.vmware.com/files/pdf/perf-vsphere-cpu_scheduler.pdf

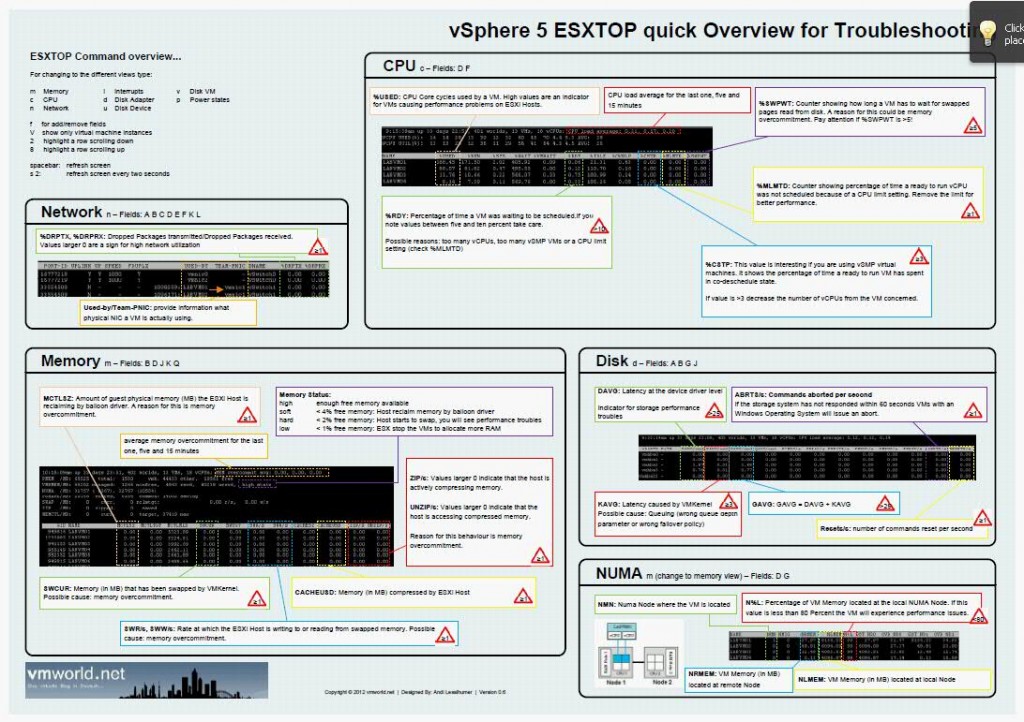
ESXTOP Troubleshooting Overview Chart

Really useful ESXTOP Overview Chart of Performance Statistics courtesy of vmworld.net