When problems occur in your virtual environment, you need to know where to look for clues to the cause and what to do to resolve them. Often, just trying to figure out the exact cause is the most difficult part, because virtual servers are more complicated than physical servers and there are more potential causes of problems. When you know where to look to find the cause of a problem, the process becomes a lot easier.
Note: By default, VMware ESXi logs do not persist upon a reboot. If a VMware ESXi host experiences an abrupt reboot due to reasons other than a VMkernel error, the logs do not persist and you do not have access to the logs prior to the reboot to determine the cause
Note: Many logfiles are time stamped using UTC – if you’re host isn’t configured to use UTC this may make correlating events and logs difficult
Types of Searches
The following types of server log entries are generated:
- Info: Displays basic status information. For example, status information is logged if the server is ready and waiting.
- Error: Displays errors that occur but do not stop the software from functioning. For example, an error is logged if a user requests secure information that they are not allowed to access.
- Error Codes: If a KB points you to an error code you can search for this in the logs
- Fatal: Displays errors that stop the software from functioning. For example, a fatal error is logged if the content server cannot access the database.
How to search through logs
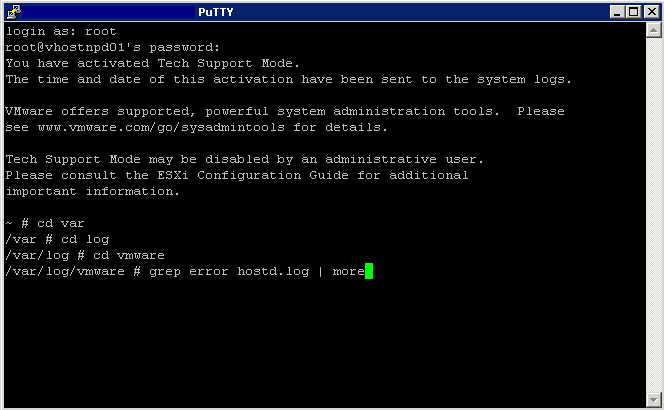
- You can use the grep command to search for specific terms
grep is a unix command that allows you to search for a pattern in a list of files
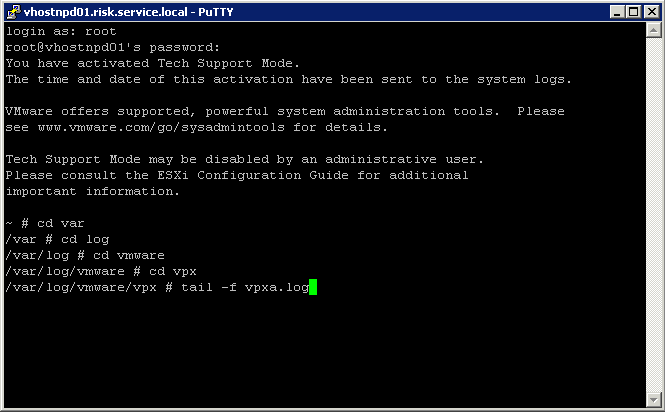
- You can use tail command tail -f /var/log/hostd.log
Many times you need to view a constantly updating file. This is a common case with logs. People usually think that tail command is only used to view the last parts of a file, but it even provides you with the ability to view growing/changing files.
Please note that, by growing I mean files to whom data is being appended constantly. Using the -f option, tail lets us view the data that is being added to the file in real time.
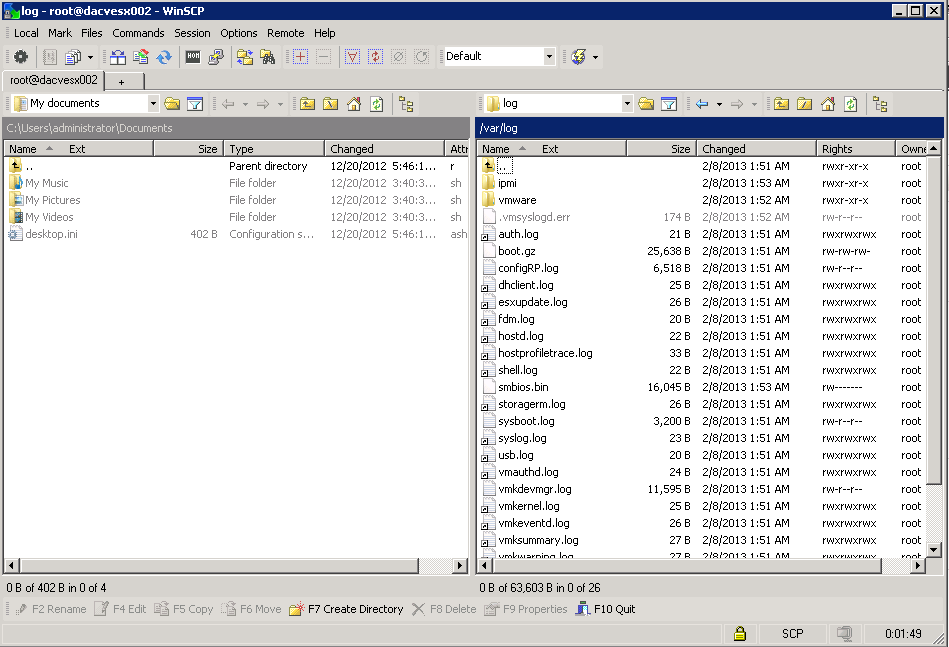
- You can use WinSCP to open logs in Notepad and search through them
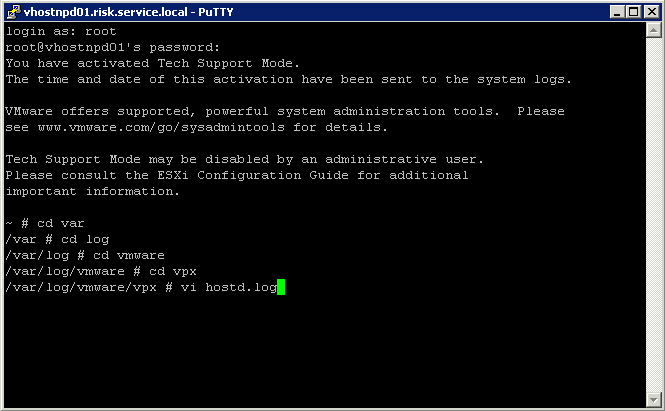
- Use the built-in text editors to open a log file. You can use nano, which is a bit easier to use, or vi to open a log file. Type nano or vi log file path/name to open one (for example, nano /var/log/vmware/hostd.log).
- There are many 3rd party Tools on the market which will also provide analysis and searching through to find what you need. Examples such as Splunk, XPoLog and vLogView
- In addition to the methods to view individual log files, you can use the vm-support command (it’s actually a script) that you can run on the ESX Service Console that will bundle together all the log files, configuration files, and output from various commands into a single TGZ file. After the file has been created, you can copy it to your workstation and extract it using the Linux tar command or WinZip
Useful Links
- VMworld 2009 session VM3325
http://www.vmworld.com/docs/DOC-3765
- And the most useful document in the world below
http://media.techtarget.com/searchServerVirtualization/downloads/0137008589_CH10.pdf
Scrolling through logs using DCUI
http://blogs.vmware.com/vsphere/2012/06/viewing-esxi-logs-from-the-dcui.html


Leave a Reply