Performance Metrics to use
- Use the inbuilt vCenter Performance charts
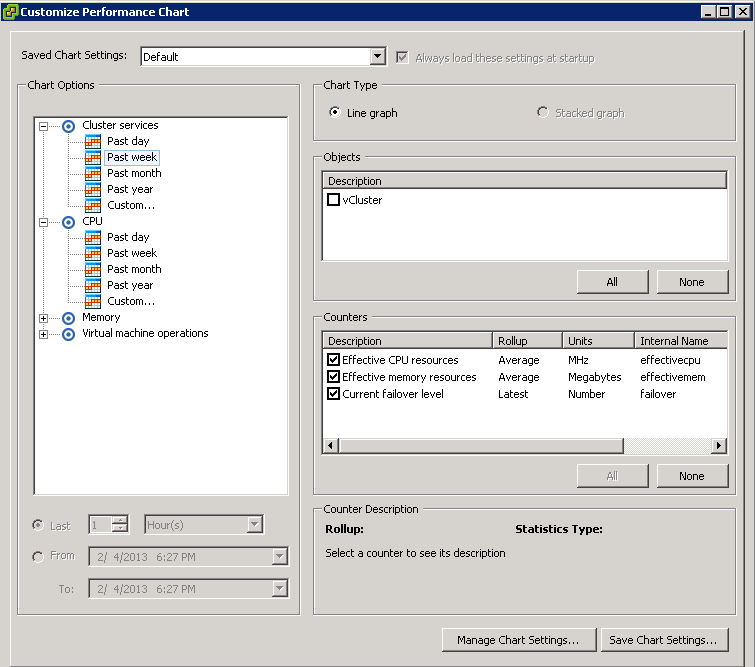
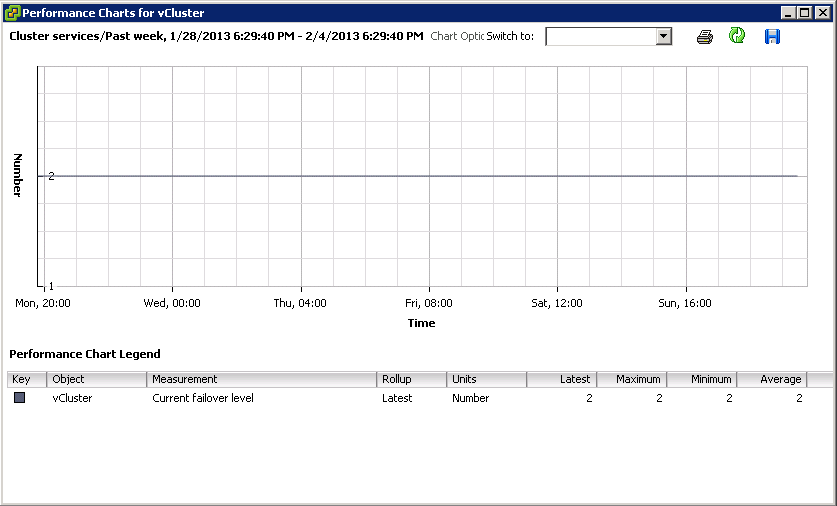
The vCenter Performance charts have 3 advanced settings which allow you to see Effective CPU Resources, Effective Memory Resources and Current Failover level
- Use ESXTOP/RESXTOP
ESXTOP and RESXTOP can be used in batch mode to monitor hosts over a day maximum. You can monitor all statistics or select the counters you want to monitor. The resulting csv file can then be imported into EXCEL, ESXPLOT or Perfmon on a Windows server to analyse the results. From these, you can probably see if there are any resources that may restrict the choice of cluster setting you apply. If you are low on resources then selecting a Specify Failover Host setting is probably not the best idea as wasting a host as a hot standby when you are already contrained for resources will take even more resource away


Leave a Reply