Tools within vCenter
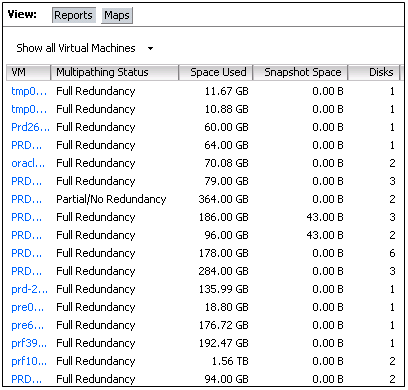
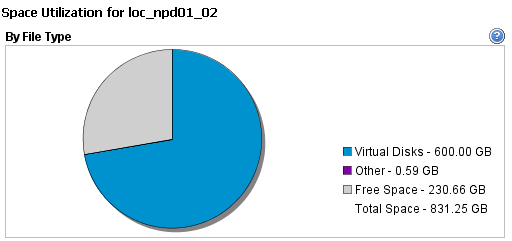
- Storage Views > Reports
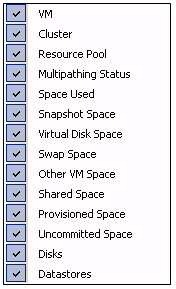
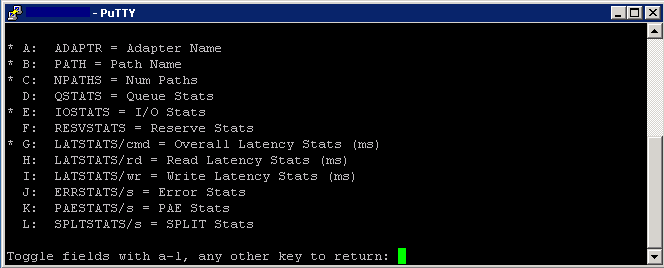
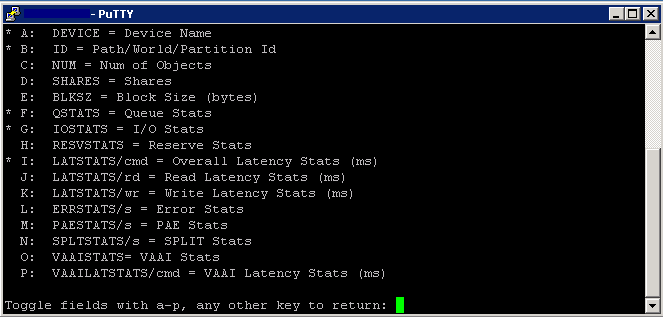
These are the settings you can select for the fields
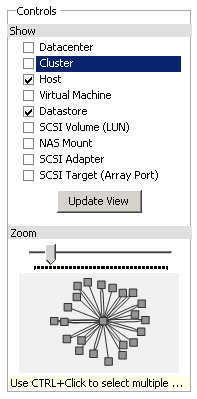
- Storage Views > Maps
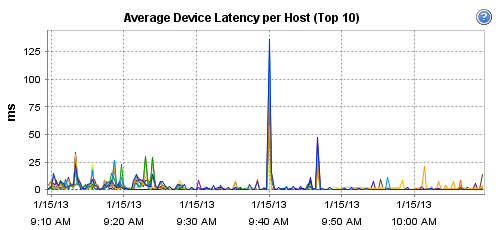
- Datastores View > Performance
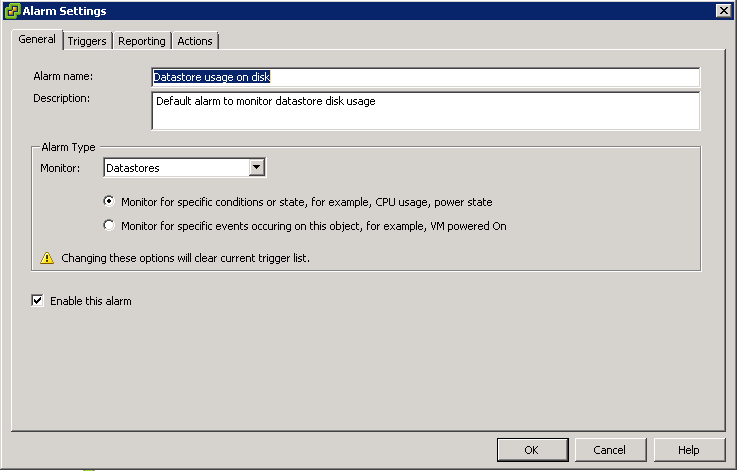
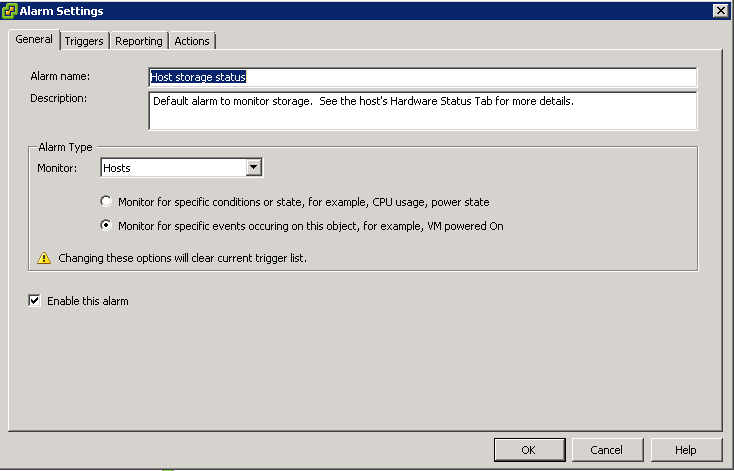
- Datastores Views > Alarms
- vscsiStats
Since ESX 3.5, VMware has provided a tool specifically for profiling storage: vscsiStats. vscsiStats collects and reports counters on storage activity. Its data is collected at the virtual SCSI device level in the kernel. This means that results are reported per VMDK (or RDM) irrespective of the underlying storage protocol. The following data are reported in histogram form:
- IO size
- Seek distance
- Outstanding IOs
- Latency (in microseconds)
- ESXTOP/RESXTOP
Type V to view Virtual Machines then type d to view disk statistics per hba. Type f to add extra fields to view other statistics
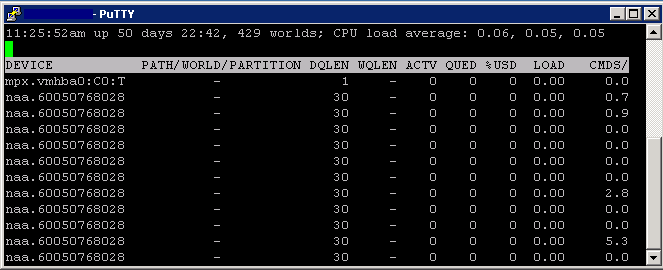
Type V to view Virtual Machines then type u to view disk statistics per device. Type f to add extra fields to view other statistics
General Disk Statistics
- CMDS/s – Number of commands issued per second.
- READS/s – Number of read commands issued per second.
- WRITES/s – Number of write commands issued per second.
- MBREAD/s – Megabytes read per second.
- MBWRTN/s – Megabytes written per second.
- KAVG – These counters track the latencies due to the ESX Kernel’s command.The KAVG value should be very small in comparison to the DAVG value and should be close to zero. When there is a lot of queuing in ESX, KAVG can be as high, or even higher than DAVG. If this happens, please check the queue statistics, which will be discussed next
- DAVG – This is the latency seen at the device driver level. It includes the roundtrip time between the HBA and the storage. DAVG is a good indicator of performance of the backend storage. If IO latencies are suspected to be causing performance problems, DAVG should be examined. Compare IO latencies with corresponding data from the storage array. If they are close, check the array for misconfiguration or faults. If not, compare DAVG with corresponding data from points in between the array and the ESX Server, e.g., FC switches. If this intermediate data also matches DAVG values, it is likely that the storage is under-configured for the application. Adding disk spindles or changing the RAID level may help in such cases.
- GAVG – This is the round-trip latency that the guest sees for all IO requests sent to the virtual storage device -GAVG = KAVG + DAVG. The average queue latency. QAVG is part of KAVG. Response time is the sum of the time spent in queues in the storage stack and the service time spent by each resource in servicing the request. The largest component of the service time is the time spent in retrieving data from physical storage. If QAVG is high, another line of investigation is to examine the queue depths at each level in the storage stack
- AQLEN – The storage adapter queue depth. This is the maximum number of ESX Server VMKernel active commands that the adapter driver is configured to support.
- LQLEN – The LUN queue depth. This is the maximum number of ESX Server VMKernel active commands that the LUN is allowed to have. (Note that, in this document, the terminologies of LUN and Storage device can be used interchangeably.)
- WQLEN – The World queue depth. This is the maximum number of ESX Server VMKernel active commands that the World is allowed to have. Note that this is a per LUN maximum for the World
- ACTV – The number of commands in the ESX Server VMKernel that are currently active. This statistic is only applicable to worlds and LUNs.
- QUED – The number of commands in the VMKernel that are currently queued. This statistic is only applicable to worlds and LUNs. Queued commands are commands waiting for an open slot in the queue. A large number of queued commands may be an indication that the storage system is overloaded. A sustained high value for the QUED counter signals a storage bottleneck which may be alleviated by increasing the queue depth. Check that LOAD < 1 after increasing the queue depth. This should also be accompanied by improved performance in terms of increased cmd/s. Note that there are queues in different storage layers. You might want to check the QUED stats for devices, and worlds
- %USD – The percentage of queue depth used by ESX Server VMKernel active commands. This statistic is only applicable to worlds and LUNs. %USD = ACTV / QLEN * 100% For world stats, WQLEN is used as the denominator. For LUN (aka device) stats, LQLEN is used as the denominator. %USD is a measure of how many of the available command queue “slots” are in use. Sustained high values indicate the potential for queueing; you may need to adjust the queue depths for system’s HBAs if QUED is also found to be consistently > 1 at the same time. Queue sizes can be adjusted in a few places in the IO path and can be used to alleviate performance problems related to latency. For detailed information on this topic please refer to the VMware whitepaper entitled “Scalable Storage Performance”
- Load – The ratio of the sum of VMKernel active commands and VMKernel queued commands to the queue depth. This statistic is only applicable to worlds and LUNs. The sum of the active and queued commands gives the total number of outstanding commands issued by that virtual machine. The LOAD counter values is the ratio of this value with respect to the queue depth. If LOAD > 1, check the value of the QUED counter.
- ABRTS/s – The number of commands aborted per second. It can indicate that the storage system is unable to meet the demands of the guest operating system. Abort commands are issued by the guest when the storage system has not responded within an acceptable amount of time, e.g. 60 seconds on some windows OS’s. Also, resets issued by a guest OS on its virtual SCSI adapter will be translated to aborts of all the commands outstanding on that virtual SCSI adaptor
- RESET(s) – The number of commands reset per second.



Leave a Reply