Archive for January 2013

Configure Datastore Clusters

What is a Datastore Cluster?

A Datastore Cluster is a collection of Datastores with shared resources and a shared management interface. When you create a Datastore cluster, you can use Storage DRS to manage storage resources and balance

  • Capacity
  • Latency

General Rules

  • Datastores from different arrays can be added to the same cluster but LUNs from arrays of different types can adversely affect performance if they are not equally performing LUNs.
  • Datastore clusters must contain similar or interchangeable Datastores
  • Datastore clusters can only have ESXi 5 hosts attached
  • Do not mix NFS and VMFS datastores in the same Datastore Cluster
  • You can mix VMFS-3 and VMFS-5 Datastores in the same Datastore Cluster
  • Datastore Clusters can only be created from the vSphere client, not the Web Client
  • A VM can have its virtual disks on different Datastores

Storage DRS

Storage DRS provides initial placement and ongoing balancing recommendations assisting vSphere administrators to make placement decisions based on space and I/O capacity. During the provisioning of a virtual machine, a Datastore Cluster can be selected as the target destination for this virtual machine or virtual disk after which a recommendation for initial placement is made based on space and I/O capacity. Initial placement in a manual provisioning process has proven to be very complex in most environments and as such crucial provisioning factors like current space utilization or I/O load are often ignored. Storage DRS ensures initial placement recommendations are made in accordance with space constraints and with respect to the goals of space and I/O load balancing. These goals aim to minimize the risk of storage I/O bottlenecks and minimize performance impact on virtual machines.

Ongoing balancing recommendations are made when

  • One or more Datastores in a Datastore cluster exceeds the user-configurable space utilization which is checked every 5 minutes
  • One or more Datastores in a Datastore cluster exceeds the user-configurable I/O latency thresholds which is checked every 8 Hours
  • I/O load is evaluated by default every 8 hours. When the configured maximum space utilization or the I/O latency threshold (15ms by default) is exceeded Storage DRS will calculate all possible moves to balance the load accordingly while considering the cost and the benefit of the migration.

Storage DRS utilizes vCenter Server’s Datastore utilization reporting mechanism to make recommendations whenever the configured utilized space threshold is exceeded.

Affinity Rules and Maintenance Mode

Storage DRS affinity rules enable controlling which virtual disks should or should not be placed on the same datastore within a datastore cluster. By default, a virtual machine’s virtual disks are kept together on the same datastore. Storage DRS offers three types of affinity rules:

  1. VMDK Anti-Affinity
    Virtual disks of a virtual machine with multiple virtual disks are placed on different datastores
  2. VMDK Affinity
    Virtual disks are kept together on the same datastore
  3. VM Anti-Affinity
    Two specified virtual machines, including associated disks, are place on different datastores

In addition, Storage DRS offers Datastore Maintenance Mode, which automatically evacuates all virtual machines and virtual disk drives from the selected datastore to the remaining datastores in the datastore cluster.

Configuring Datastore Clusters on the vSphere Web Client

  • Log into your vSphere client and click on the Datastores and Datastore Clusters view
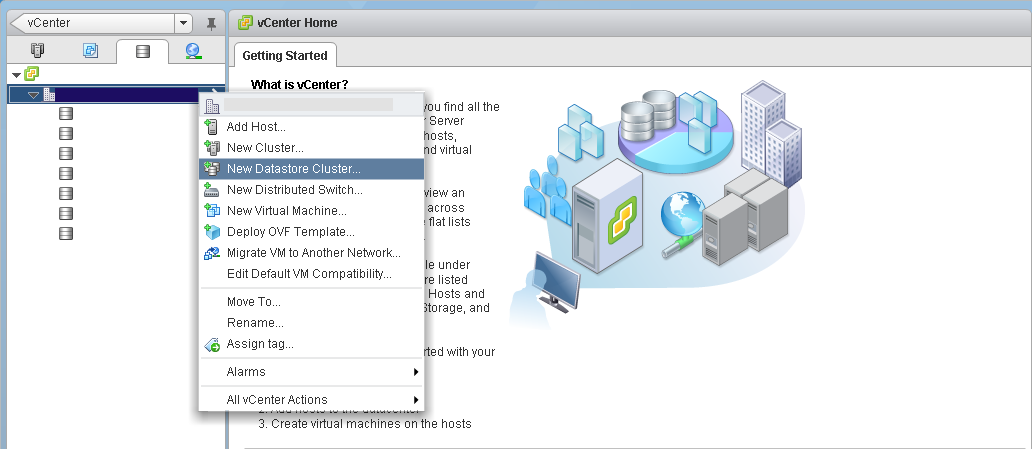
  • Right-click on your Datacenter object and select New Datastore Cluster

figure1

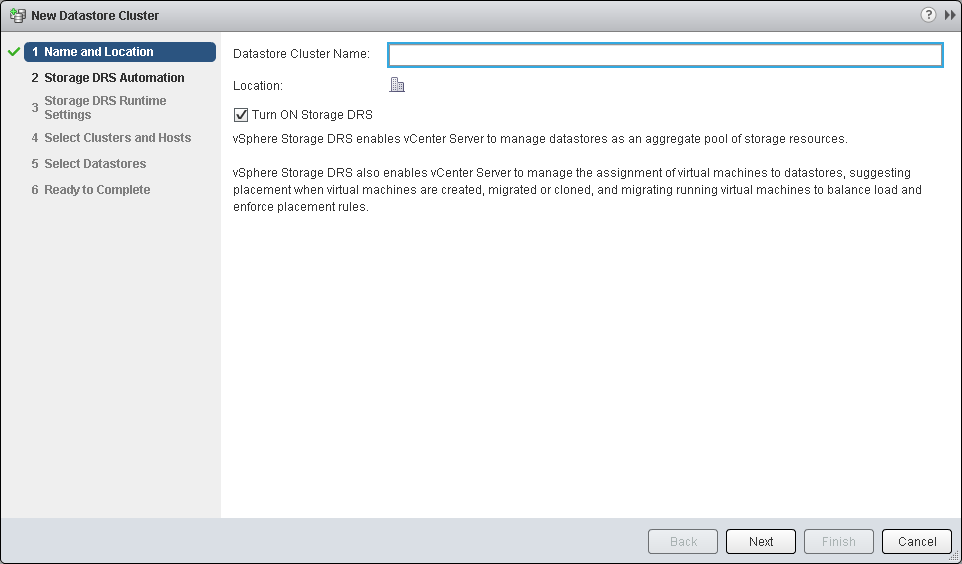
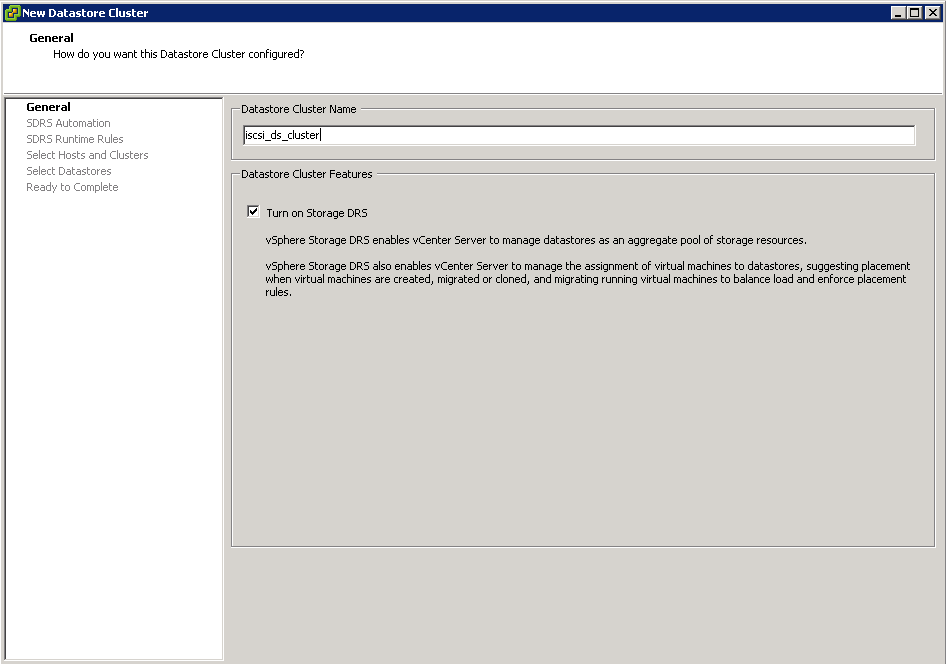
  • Enter in a name for the Datastore Cluster and choose whether or not to enable Storage DRS

figure2

  • Click Next
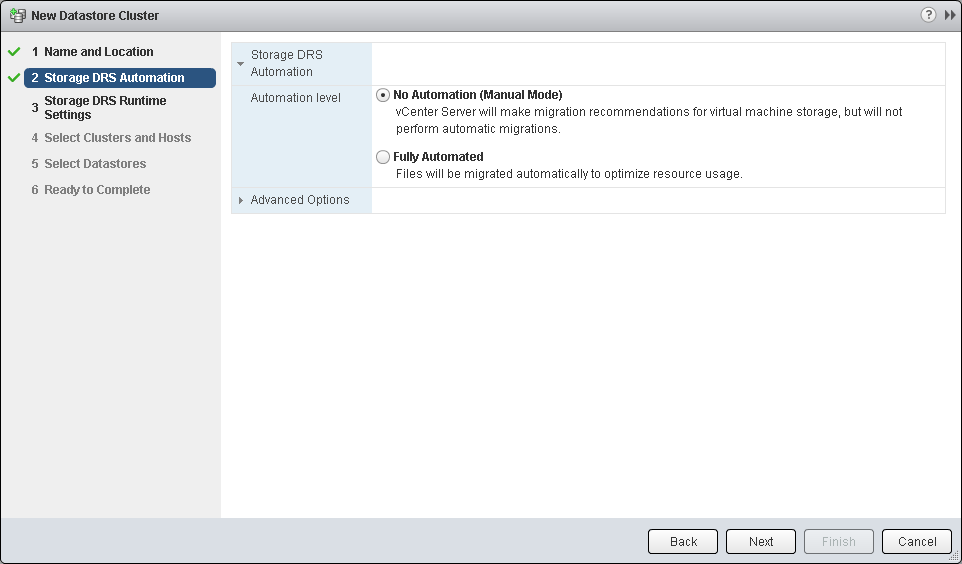
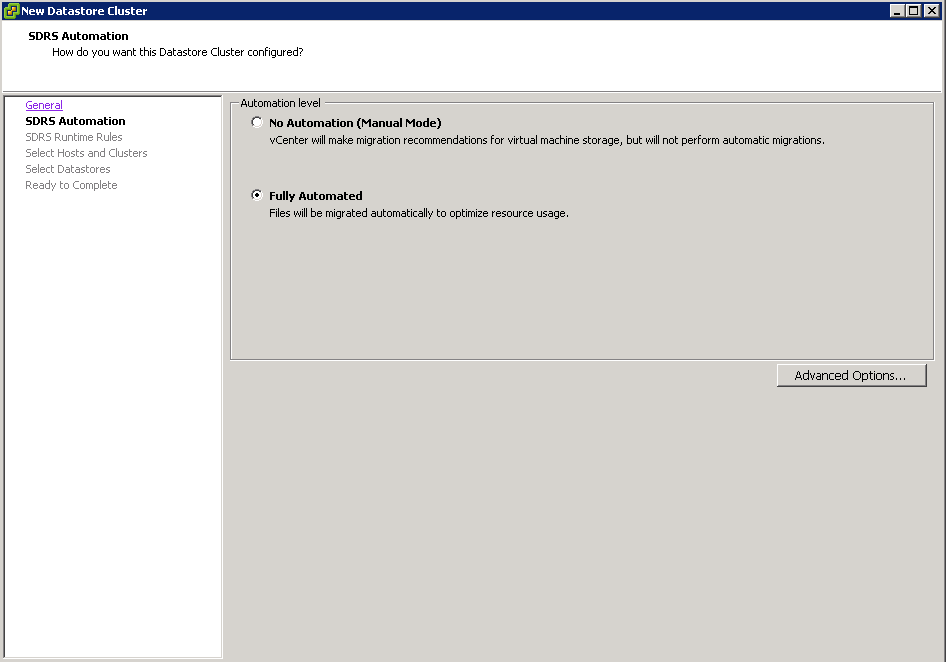
  • You can now choose whether you want a “Fully Automated” cluster that migrates files on the fly in order to optimize the Datastore cluster’s performance and utilization, or, if you prefer, you can select No Automation to approve recommendations.

figure3

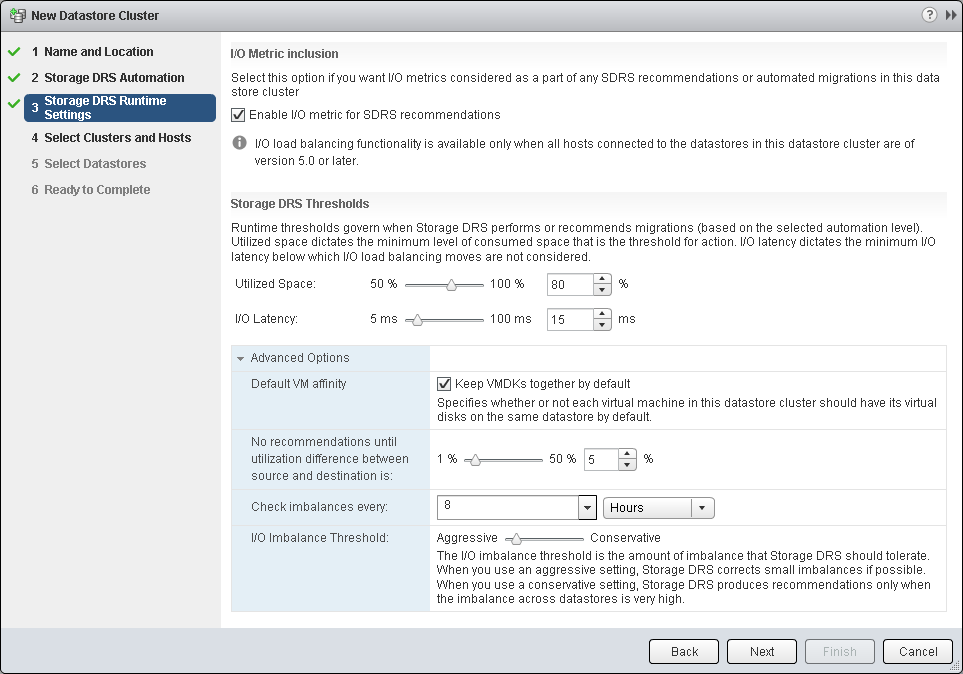
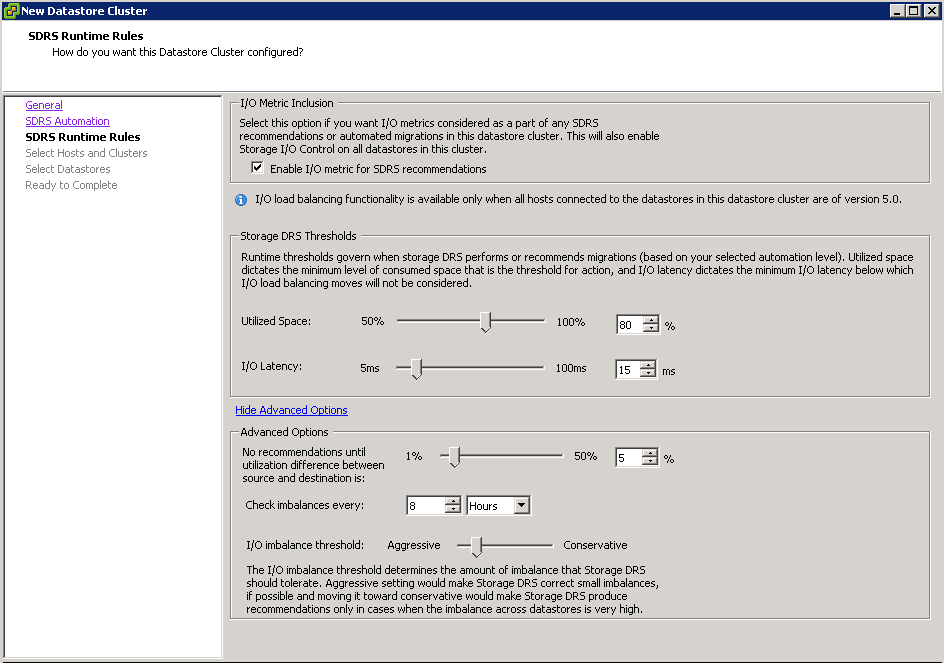
  • Here you can decide what utilization levels or I/O Latency will trigger SDRS action. To benefit from I/O metric, all your hosts that will be using this datastore cluster must be version 5.0 or later. Here you can also access some advanced and very important settings like defining what is considered a marginal benefit for migration, how often does SDRS check for imbalance and how aggressive should the algorithm be

figure4

  • I/O Latency only applicable if Enable I/O metric for SDRS recommendations is ticked
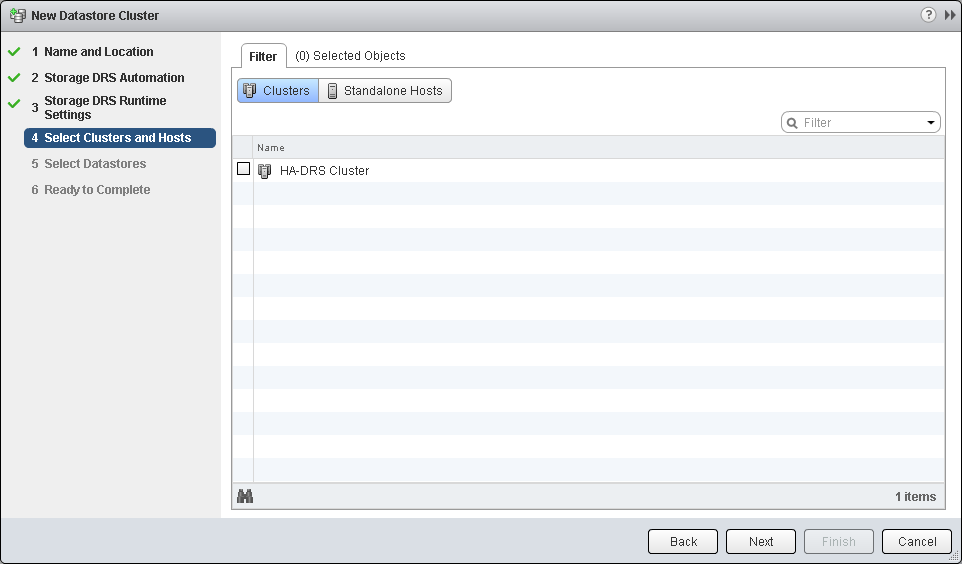
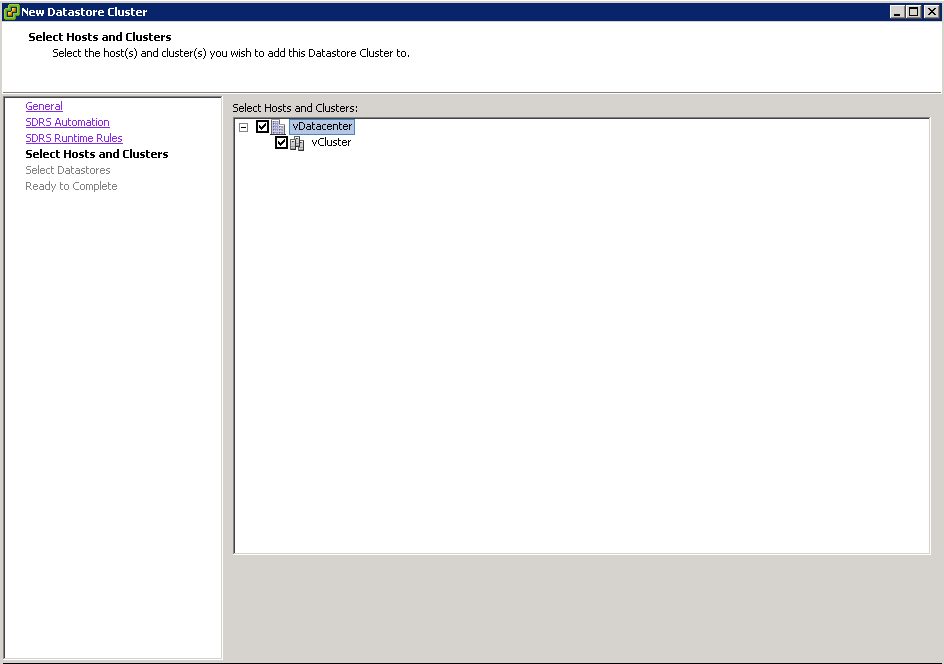
  • Next you pick what standalone hosts and/or host clusters will have access to the new Datastore Cluster

figure5

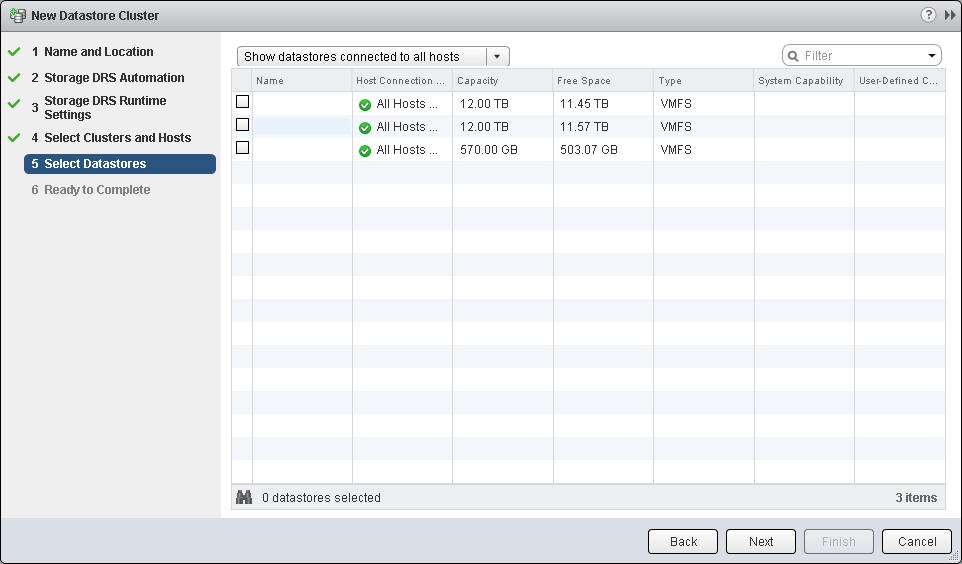
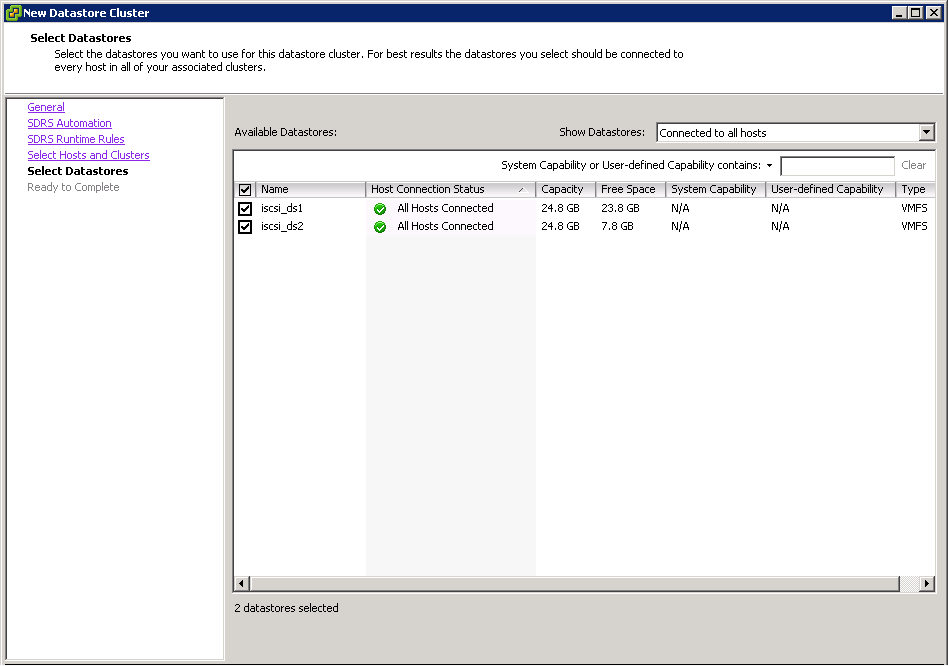
  • Select from the list of datastores that can be included in the cluster. You can list datastores that are connected to all hosts, some hosts or all datastores that are connected to any of the hosts and/or clusters you have chosen in the previous step.

figure6

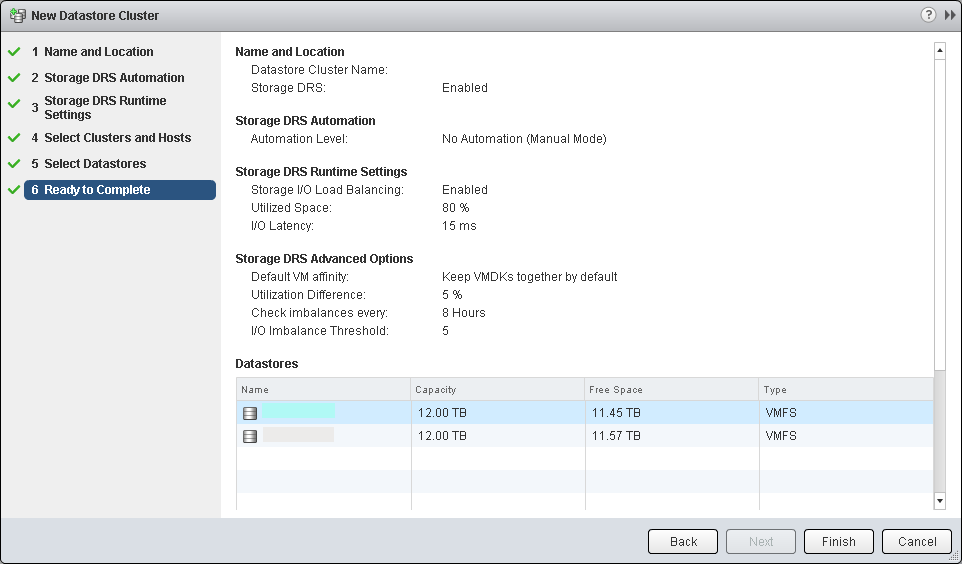
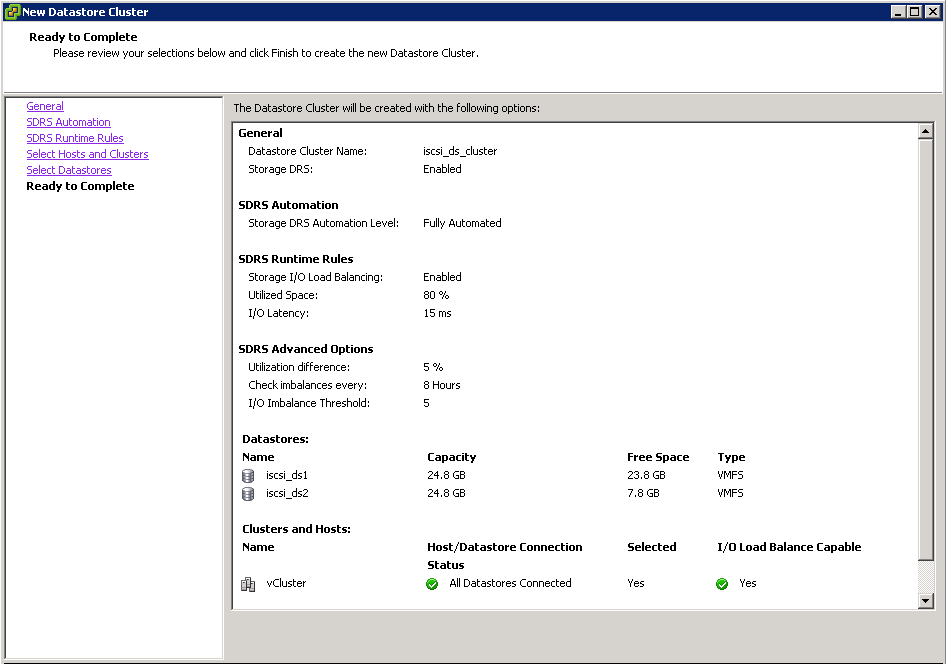
  • At this point check all your selections

figure7

  • Click Finish

vSphere Client Procedure

  • Right click the Datacenter and select New Datastore Cluster
  • Put in a name

cluster1

  • Click Next and select the level of automation you want

cluster2

  • Click Next and choose your sDRS Runtime Rules

cluster3

  • Click Next and select Hosts and Clusters

cluster4

  • Click Next and select your Datastores

cluster5

  • Review your settings

cluster6

  • Click Finish
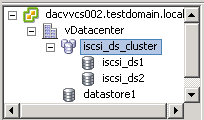
  • Check the Datastores view
cluster7

Understand interactions between virtual storage provisioning and physical storage provisioning

handshake

Key Points

All these points have been covered in other blog posts before so these are just pointers. Please search for further information on this blog

  • RDM in Physical Mode
  • RDM in Virtual Mode
  • Normal Virtual Disk (Non RDM)
  • Type of Virtual hardware. E.g Paravirtual/Non Paravirtual
  • VMware vStorage APIs for Array Integration (VAAI)
  • Three virtual disk modes: Independent persistent, Independent nonpersistent, and Snapshot
  • Types of Disk (Thin, Thick, Eager Zeroed)
  • Partition alignment
  • Consider Disk queues, HBA queues, LUN queues
  • Consider hardware redundancy. E.g Multiple vkernel ports corresponding to iSCSI
  • Storage I/O Control
  • SAN Multipathing
  • Host power management settings: Some of the power management features in newer server hardware can increase storage latency

Provision and manage storage resources according to Virtual Machine requirements

Checklist1

Provision and Manage VM Storage Resources

I am going to bullet point most of this as some of it has been covered before

  • Vendor recommendations need to be taken into account
  • Type of storage. E.g FC, iSCSI, NFS etc
  • VM Swap file placement
  • What RAID storage
  • Use Tiered storage to separate High Performance VMs from Lower performing VMs
  • Choose Virtual Disk formats as required. Eager Zeroed, Thick and Thin etc
  • Initial size of disk + growth + swap file
  • VM Virtual Hardware. E.g SCSI Controllers
  • Types of disk. E.g Virtual Disk or RDM
  • NPIV requirements
  • Make sure you adhere to the vSphere Configuation maximums
  • Is replication required
  • Make sure you have a good idea of how much I/O will be generated
  • Disk alignment will be required for certain O/S’s
  • Are snapshots required
  • Will the VM be fault tolerant

Configure Datastore alarms

Configure Datastore alarms

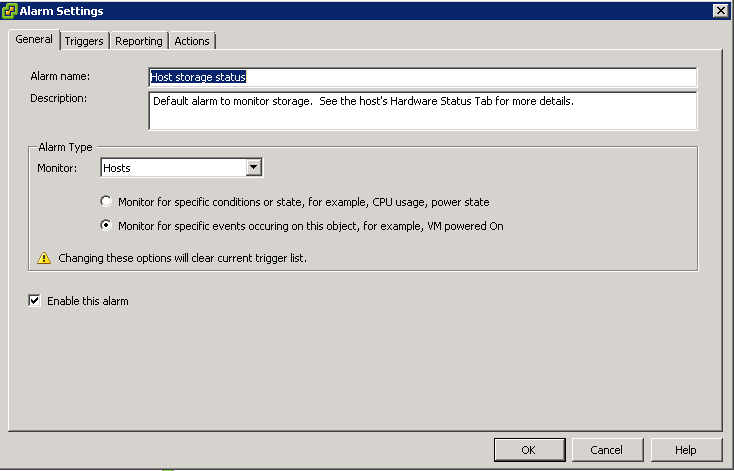
There are five pre-configured datastore alarms that ship with vSphere 5

datastorealarms

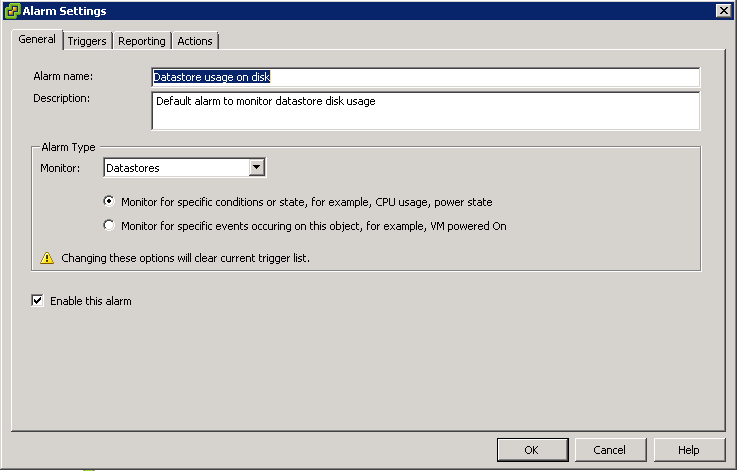
To create a Datastore alarm

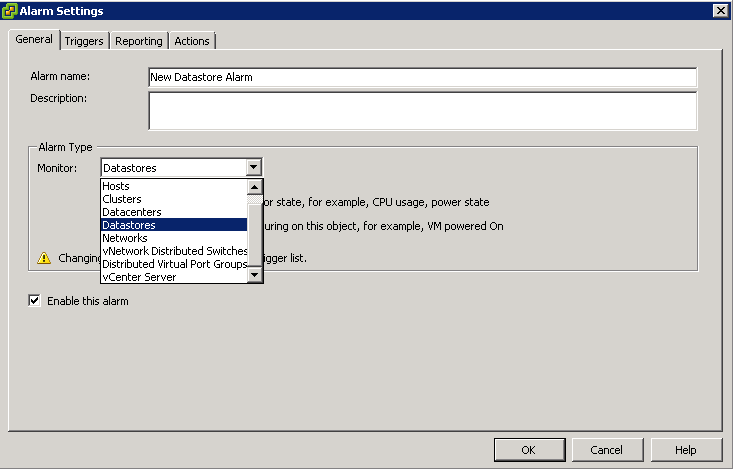
  • Right click on the vCenter icon in the vClient and select Alarm > Add Alarm
  • Click the Drop Down on Alarm Type and Select Datastores
  • You have 2 choices to monitor – Select your preference
  • Monitor for specific conditions or state, for example, CPU usgae, power state
  • Monitor for specific events occurring on this object, for example, VM powered on
  • Tick Enable this alarm

data1

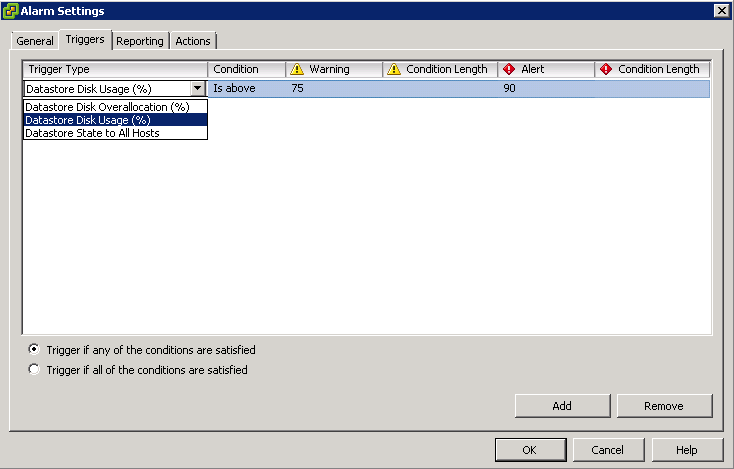
  • Click Triggers
  • Click Add
  • Under Trigger Type, you can see several triggers associated with this alarm
  • Choose Datastore Disk Usage

data2

  • Click the Drop Down on Condition and select Is above or Is below
  • Click the Drop Down on Warning and select 75% or change as required
  • Click the Drop Down on Condition length and set as required. Sometimes it will not let you set this if it is not relevant
  • Click the Drop Down on Warning and select 90% or change as required
  • At the bottom of the screen there are 2 options. Choose the one you require
  • Trigger if any of the conditions are satisfied
  • Trigger if all of the conditions are satisfied
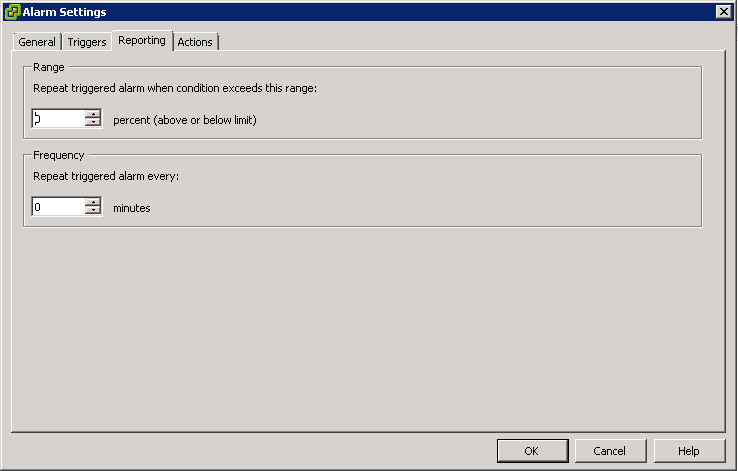
  • Click the Reporting tab
  • Under Range there is an option Repeat triggered alarm when the condition exceeds this range

A 0 value triggers and clears the alarm at the threshold point you configured. A non-zero value triggers the alarm only after the condition reaches an additional percentage above or below the threshold point.
Condition threshold + Reporting Tolerance = trigger alarmTolerance values ensure you do not transition alarm states based on false changes in a condition

  • Under Frequency there is an option Repeat triggered alarms every

The frequency sets the time period during which a triggered alarm is not reported again. When the time period has elapsed, the alarm will report again if the condition or state is still true

data3

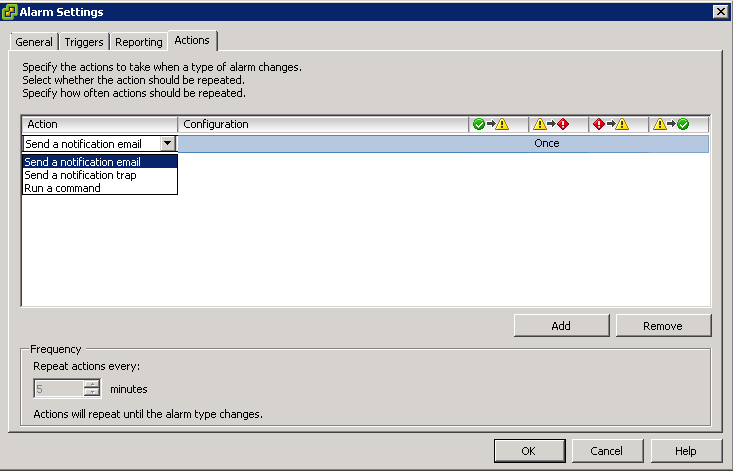
  • Click the Actions tab
  • Click Add
  • Click the Drop Down box on Action and Select Send a notification email

data4

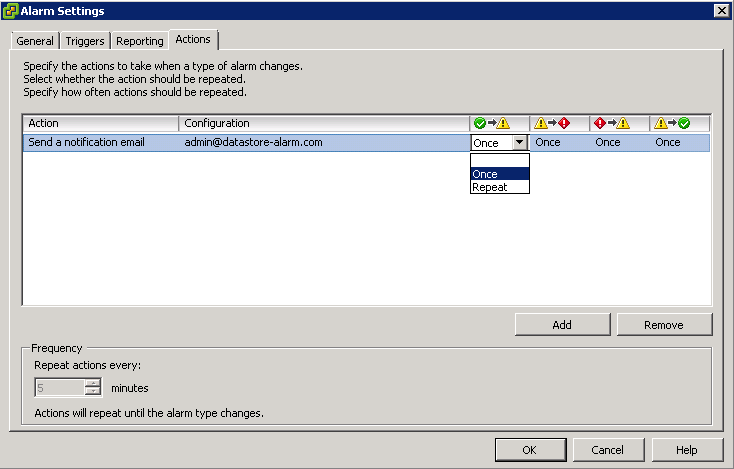
  • If you chose Send a notification email or Send a notification trap as the alarm action, make sure the notification settings are configured for vCenter Server
  • Double click Configuration and enter an email address
  • In the next boxes are the alarm status triggers. Set a frequency for sending an email each time the triggers occur

data5

Click OK to Finish

Apply space utilization data to manage storage resources

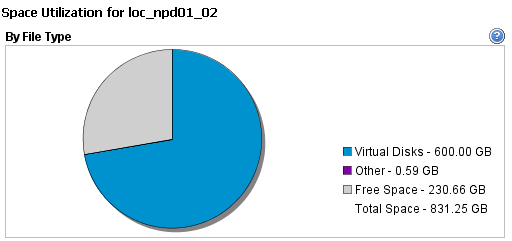
The df Command

Used for checking disk space usage on the ESX/ESXi service console partitions

This objective on the VCAP-DCA exam is slightly ambiguous but I have decided to focus on the command “df” which stands for disk filesystemor disk free. This command is used to display the filesystems that are mounted to that particular host and the usage associated with these filesystems

The “-h” switch makes the output human readable

Instructions

  • Log into an SSH session or vMA or locally whichever you prefer
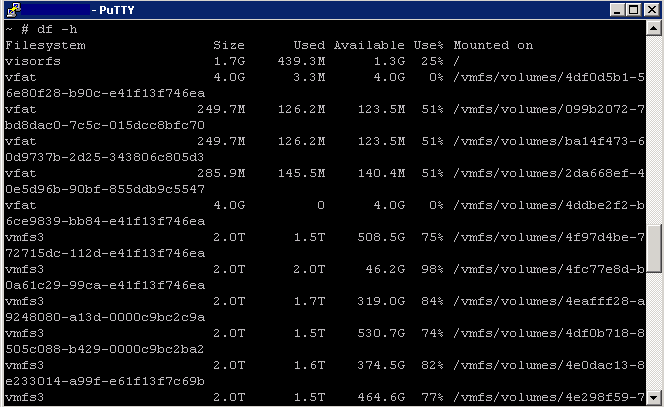
  • Type df-h to view an easily readable format
df

  • Review the Use% for each of the listed items. If any of the volumes listed are 100% full, they must be investigated to determine if space can be freed. The most important mount points to investigate on a default installation of ESX are the / and /var/log mounts because if they are full they can prevent proper operation of the ESX host
  • VisorFS is a Special-purpose File System for Efficient Handling of System Images
  • The vfat partition is created for new installations of ESXi, during the autoconfiguration phase. In vSphere 5 it is now a 4GB vfat scratch partition

The vdf Command

Checking disk space usage on a VMFS volume of an ESX/ESXi host

  • Log into an SSH session or vMA or locally whichever you prefer
  • Type vdf-h to view an easily readable format
Capture4

  •  Review the Use% for each of the listed items. If any of the volumes listed are 100% full, they must be investigated to determine if space can be freed. If a VMFS volume is full you cannot create any new virtual machines and any virtual machines that are using snapshots may fail
Useful VMware KB Article

http://kb.vmware.com/selfservice/microsites/search.do?language=en_US&cmd=displayKC&externalId=1003564

Identify available Storage Monitoring Tools, metrics and alarms

Tools within vCenter

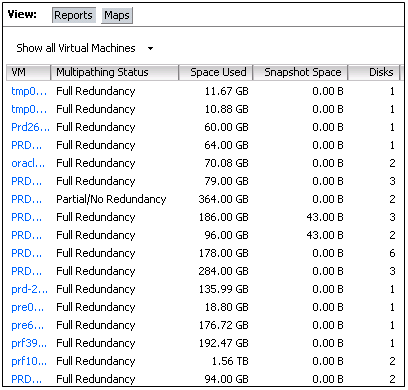
  • Storage Views > Reports

test

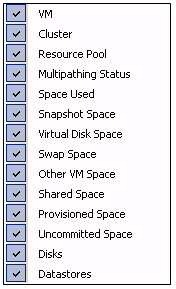
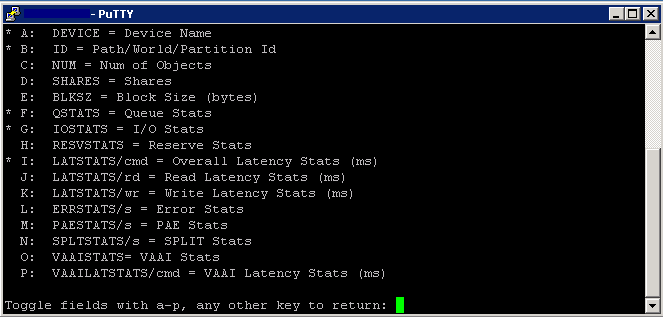
These are the settings you can select for the fields

perf4

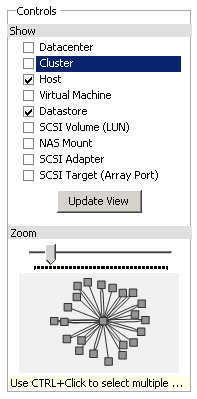
  • Storage Views > Maps

maps2

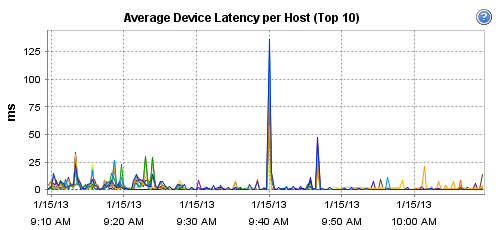
  • Datastores View > Performance

perf

perf2

  • Datastores Views > Alarms

alarm1

alarm2

  • vscsiStats

Since ESX 3.5, VMware has provided a tool specifically for profiling  storage: vscsiStats.  vscsiStats collects and reports counters on  storage activity.  Its data is collected at the virtual SCSI device  level in the kernel.  This means that results are reported per VMDK (or  RDM) irrespective of the underlying storage protocol.  The following  data are reported in histogram form:

  • IO size
  • Seek distance
  • Outstanding IOs
  • Latency (in microseconds)
  • ESXTOP/RESXTOP

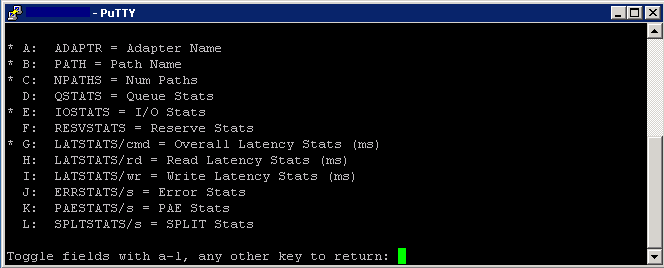
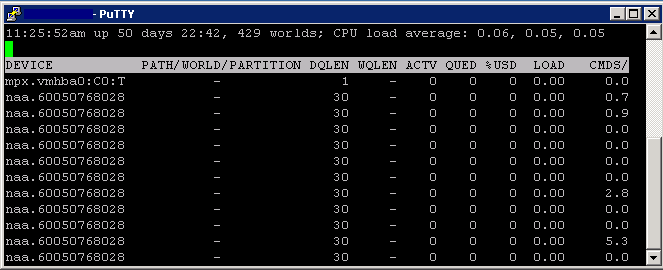
Type V to view Virtual Machines then type d to view disk statistics per hba. Type f to add extra fields to view other statistics

hba

hba2

Type V to view Virtual Machines then type u to view disk statistics per device. Type f to add extra fields to view other statistics

device1

device2

General Disk Statistics

  • CMDS/s – Number of commands issued per second.
  • READS/s – Number of read commands issued per second.
  • WRITES/s – Number of write commands issued per second.
  • MBREAD/s – Megabytes read per second.
  • MBWRTN/s – Megabytes written per second.
  • KAVG – These counters track the latencies due to the ESX Kernel’s command.The KAVG value should be very small in comparison to the DAVG value and should be close to zero. When there is a lot of queuing in ESX, KAVG can be as high, or even higher than DAVG. If this happens, please check the queue statistics, which will be discussed next
  • DAVG – This is the latency seen at the device driver level. It includes the roundtrip time between the HBA and the storage. DAVG is a good indicator of performance of the backend storage. If IO latencies are suspected to be causing performance problems, DAVG should be examined. Compare IO latencies with corresponding data from the storage array. If they are close, check the array for misconfiguration or faults. If not, compare DAVG with corresponding data from points in between the array and the ESX Server, e.g., FC switches. If this intermediate data also matches DAVG values, it is likely that the storage is under-configured for the application. Adding disk spindles or changing the RAID level may help in such cases.
  • GAVG – This is the round-trip latency that the guest sees for all IO requests sent to the virtual storage device -GAVG = KAVG + DAVG. The average queue latency. QAVG is part of KAVG. Response time is the sum of the time spent in queues in the storage stack and the service time spent by each resource in servicing the request. The largest component of the service time is the time spent in retrieving data from physical storage. If QAVG is high, another line of investigation is to examine the queue depths at each level in the storage stack
  • AQLEN – The storage adapter queue depth. This is the maximum number of ESX Server VMKernel active commands that the adapter driver is configured to support.
  • LQLEN – The LUN queue depth. This is the maximum number of ESX Server VMKernel active commands that the LUN is allowed to have. (Note that, in this document, the terminologies of LUN and Storage device can be used interchangeably.)
  • WQLEN – The World queue depth. This is the maximum number of ESX Server VMKernel active commands that the World is allowed to have. Note that this is a per LUN maximum for the World
  • ACTV – The number of commands in the ESX Server VMKernel that are currently active. This statistic is only applicable to worlds and LUNs.
  • QUED – The number of commands in the VMKernel that are currently queued. This statistic is only applicable to worlds and LUNs. Queued commands are commands waiting for an open slot in the queue. A large number of queued commands may be an indication that the storage system is overloaded. A sustained high value for the QUED counter signals a storage bottleneck which may be alleviated by increasing the queue depth. Check that LOAD < 1 after increasing the queue depth. This should also be accompanied by improved performance in terms of increased cmd/s. Note that there are queues in different storage layers. You might want to check the QUED stats for devices, and worlds
  • %USD – The percentage of queue depth used by ESX Server VMKernel active commands. This statistic is only applicable to worlds and LUNs. %USD = ACTV / QLEN * 100% For world stats, WQLEN is used as the denominator. For LUN (aka device) stats, LQLEN is used as the denominator. %USD is a measure of how many of the available command queue “slots” are in use. Sustained high values indicate the potential for queueing; you may need to adjust the queue depths for system’s HBAs if QUED is also found to be consistently > 1 at the same time. Queue sizes can be adjusted in a few places in the IO path and can be used to alleviate performance problems related to latency. For detailed information on this topic please refer to the VMware whitepaper entitled “Scalable Storage Performance”
  • Load – The ratio of the sum of VMKernel active commands and VMKernel queued commands to the queue depth. This statistic is only applicable to worlds and LUNs. The sum of the active and queued commands gives the total number of outstanding commands issued by that virtual machine. The LOAD counter values is the ratio of this value with respect to the queue depth. If LOAD > 1, check the value of the QUED counter.
  • ABRTS/s – The number of commands aborted per second. It can indicate that the storage system is unable to meet the demands of the guest operating system. Abort commands are issued by the guest when the storage system has not responded within an acceptable amount of time, e.g. 60 seconds on some windows OS’s. Also, resets issued by a guest OS on its virtual SCSI adapter will be translated to aborts of all the commands outstanding on that virtual SCSI adaptor
  • RESET(s) – The number of commands reset per second.

Identify storage provisioning methods

Overview of Storage Provisioning methods

Storage

Types of Storage

Local (Block Storage)

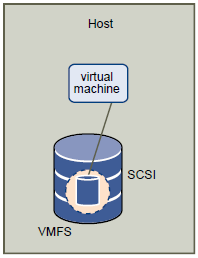
Local storage can be internal hard disks located inside your ESXi host, or it can be external storage systems located outside and connected to the host directly through protocols such as SAS or SATA. The host uses a single connection to a storage disk. On that disk,
you can create a VMFS Datastore, which you use to store virtual machine disk files.Although this storage configuration is possible, it is not a recommended topology. Using single connections between storage arrays and hosts creates single points of failure (SPOF) that can cause interruptions when a connection becomes unreliable or fails.
ESXi supports a variety of internal or external local storage devices, including SCSI, IDE, SATA, USB, and SAS storage systems. Regardless of the type of storage you use, your host hides a physical storage layer from virtual machines

Local

Networked Storage

Networked storage consists of external storage systems that your ESXi host uses to store virtual machine files remotely. Typically, the host accesses these systems over a high-speed storage network.
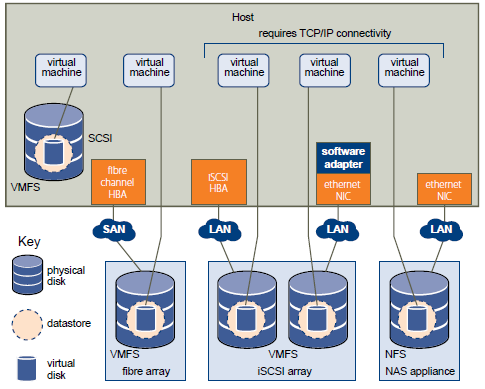
Networked storage devices are shared. Datastores on networked storage devices can be accessed by multiple hosts concurrently. ESXi supports the following networked storage technologies.

FC (Block Storage)

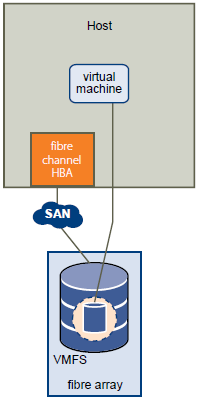
Stores virtual machine files remotely on an FC storage area network (SAN). FC SAN is a specialized high-speed network that connects your hosts to high-performance storage devices. The network uses Fibre Channel protocol to transport SCSI traffic from virtual machines to the FC SAN devices.
To connect to the FC SAN, your host should be equipped with Fibre Channel host bus adapters (HBAs). Unless you use Fibre Channel direct connect storage, you need Fibre Channel switches to route storage traffic.

FCOE (Block Storage)

If your host contains FCoE (Fibre Channel over Ethernet) adapters, you can connect to your shared Fibre Channel devices by using an Ethernet network.

FC

Internet SCSI (iSCSI) (Block Storage)

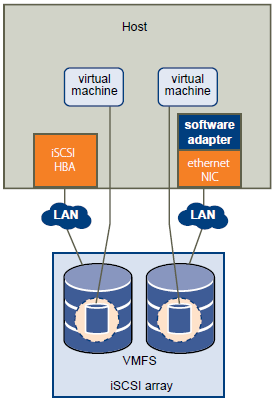
Stores virtual machine files on remote iSCSI storage devices. iSCSI packages SCSI storage traffic into the TCP/IP protocol so that it can travel through standard TCP/IP networks instead of the specialized FC network. With an iSCSI connection, your host serves as the initiator that communicates with a target, located in remote iSCSI storage systems. ESXi offers the following types of iSCSI connections:

  • Hardware iSCSI Your host connects to storage through a third-party adapter capable of offloading the iSCSI and network processing. Hardware adapters can be dependent and independent. This is shown on the left adapter on the picture below
  • Software iSCSI Your host uses a software-based iSCSI initiator in the VMkernel to connect to storage. With this type of iSCSI connection, your host needs only a standard network adapter for network connectivity. This is shown on the right adapter on the picture below

iSCSI

Network-attached Storage (NAS) (File Level Storage)

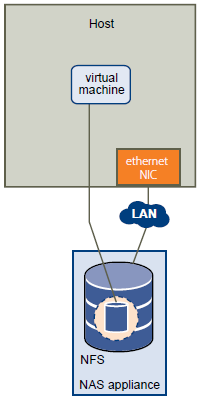
Stores virtual machine files on remote file servers accessed over a standard TCP/IP network. The NFS client built into ESXi uses Network File System (NFS) protocol version 3 to communicate with the NAS/NFS servers. For network connectivity, the host requires a standard network adapter.

NFS

Comparison of Storage Features

storage2

Predictive and Adaptive Schemes for Datastores

When setting up storage for ESXi systems, before creating VMFS datastores, you must decide on the size and number of LUNs to provision. You can experiment using the predictive scheme and the Adaptive Scheme

Predictive

  • Provision several LUNs with different storage characteristics.
  • Create a VMFS datastore on each LUN, labeling each datastore according to its characteristics.
  • Create virtual disks to contain the data for virtual machine applications in the VMFS datastores created on LUNs with the appropriate RAID level for the applications’ requirements.
  • Use disk shares to distinguish high-priority from low-priority virtual machines.

NOTE: Disk shares are relevant only within a given host. The shares assigned to virtual machines on one host have no effect on virtual machines on other hosts.

  • Run the applications to determine whether virtual machine performance is acceptable.

Adaptive

When setting up storage for ESXi hosts, before creating VMFS datastores, you must decide on the number and size of LUNS to provision. You can experiment using the adaptive scheme.

  • Provision a large LUN (RAID 1+0 or RAID 5), with write caching enabled.
  • Create a VMFS on that LUN.
  • Create four or five virtual disks on the VMFS.
  • Run the applications to determine whether disk performance is acceptable
  • If performance is acceptable, you can place additional virtual disks on the VMFS. If performance is not acceptable, create a new, large LUN, possibly with a different RAID level, and repeat the process. Use migration so that you do not lose virtual machines data when you recreate the LUN.

Tools for provisioning storage

  • vClient
  • Web Client
  • vmkfstools
  • SAN Vendor Tools

VMware Link

http://www.vmware.com/files/pdf/techpaper/Storage_Protocol_Comparison.pdf