What is it?
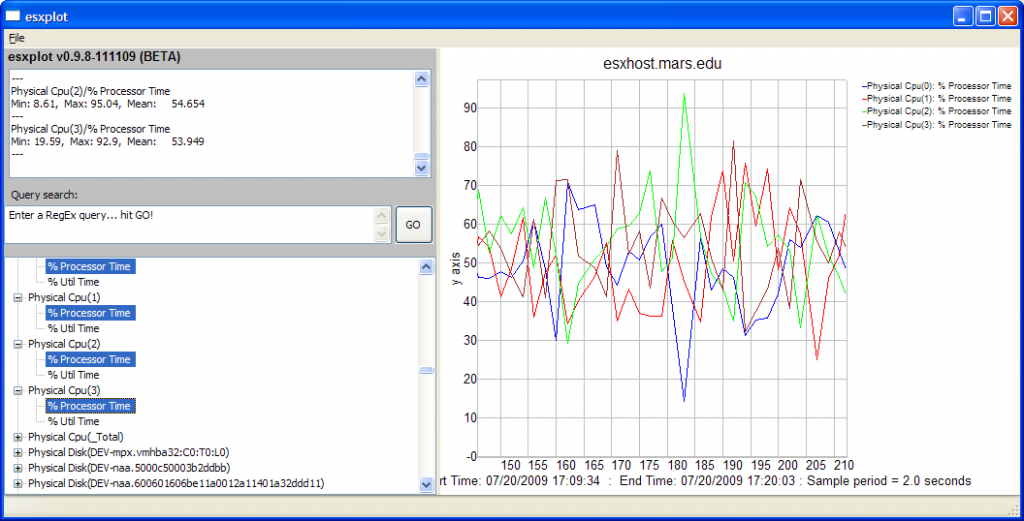
Esxplot is a GUI-based tool that lets you explore the data collected by esxtop in batch mode. The program loads files of this data and presents it as a hierarchical tree where the values are selectable in the left panel of the tool, and graphs of the selected metrics are plotted in the right panel.
Esxplot allows you to “browse” the contents of these somewhat unwieldy files. You can plot up to 16 metrics on the same canvas and export the graphs to a gif, jpg, png or bmp file format. Subsets of the data can be worked with by using the regex query box which will produce a subtree that can be browsed or exported as a csv file which can, in turn, be loaded into esxplot, PERFMON or Excel.
The program is written in Python language and uses the platform-independent Window library, wxPython. Python programs written in wxPython can run unchanged on Linux, Windows, and OSX. In order to run esxplot you need to have Python 2.6.x or later installed (this program will not yet run under Python 3.x due to the lack of wxPython support)
Screenprint
Running ESXPLOT
- Run: esxplot
- Click File -> Import -> Dataset
- Select file and click “Open”
- Double click host name and click on metric
Link
http://labs.vmware.com/flings/esxplot


