Windows Reliability and Performance Monitor is a Microsoft Management Console (MMC) snap-in that combines the functionality of previous stand-alone tools including Performance Logs and Alerts, Server Performance Advisor, and System Monitor. It provides a graphical interface for customizing performance data collection and Event Trace Sessions.
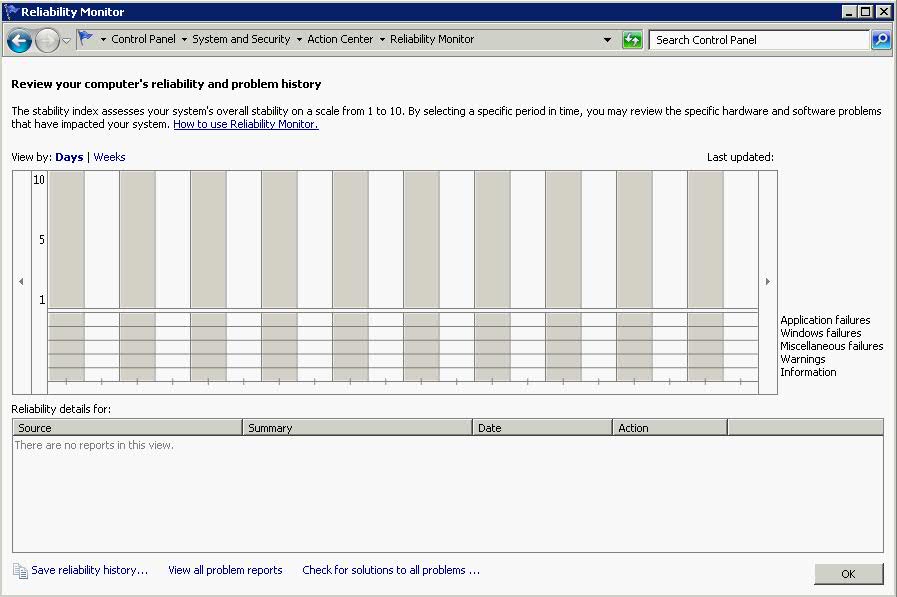
It also includes Reliability Monitor, an MMC snap-in that tracks changes to the system and compares them to changes in system stability, providing a graphical view of their relationship
Features of Windows Reliability and Performance Monitor new to Windows Server 2008 include the following.
Data Collector Sets
An important new feature in Windows Reliability and Performance Monitor is the Data Collector Set, which groups data collectors into reusable elements for use with different performance monitoring scenarios. Once a group of data collectors are stored as a Data Collector Set, operations such as scheduling can be applied to the entire set through a single property change.
Windows Reliability and Performance Monitor also includes default Data Collector Set templates to help system administrators begin collecting performance data specific to a Server Role or monitoring scenario immediately.
Wizards and templates for creating logs
Adding counters to log files and scheduling their start, stop, and duration can now be performed through a Wizard interface. In addition, saving this configuration as a template allows system administrators to collect the same log on subsequent computers without repeating the data collector selection and scheduling processes. Performance Logs and Alerts features have been incorporated into the Windows Reliability and Performance Monitor for use with any Data Collector Set.
Resource View
The home page of Windows Reliability and Performance Monitor is the new Resource View screen, which provides a real-time graphical overview of CPU, disk, network, and memory usage. By expanding each of these monitored elements, system administrators can identify which processes are using which resources. In previous versions of Windows, this real-time process-specific data was only available in limited form in Task Manager.
Reliability Monitor
Reliability Monitor calculates a System Stability Index that reflects whether unexpected problems reduced the reliability of the system. A graph of the Stability Index over time quickly identifies dates when problems began to occur. The accompanying System Stability Report provides details to help troubleshoot the root cause of reduced reliability. By viewing changes to the system (installation or removal of applications, updates to the operating system, or addition or modification of drivers) side by side with failures (application failures, operating system crashes, or hardware failures), a strategy for addressing the issues can be developed quickly.
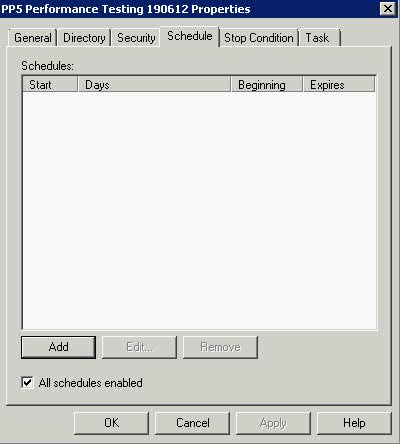
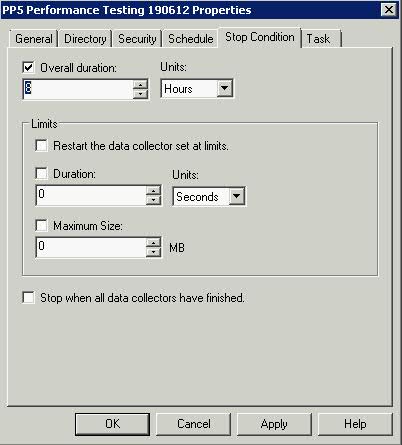
Unified property configuration for all data collection, including scheduling
Whether creating a Data Collector Set for one time use or to log activity on an ongoing basis, the interface for creation, scheduling, and modification is the same. If a Data Collector Set proves to be useful for future performance monitoring, it does not need to be re-created. It can be reconfigured or copied as a template.
User-friendly diagnosis reports
Users of Server Performance Advisor in Windows Server 2003 can now find the same kinds of diagnosis reports in Windows Reliability and Performance Monitor in Windows Server 2008. Report generation time is improved and reports can be created from data collected by using any Data Collector Set. This allows system administrators to repeat reports and assess how changes have affected performance or the report’s recommendations.
Accessing Performance Monitor
Membership in the local Performance Log Users group, or equivalent, is the minimum required to complete this procedure.
To start Performance Monitor
- Click Start, click in the Start Search box, type perfmon, and press ENTER.
- In the navigation tree, expand Monitoring Tools, and then click Performance Monitor.
You can also use Performance Monitor to view real-time performance data on a remote computer.
Membership in the target computer’s Performance Log Users group, or equivalent, is the minimum required to complete this procedure
To view performance counters from a remote computer, the Performance Logs and Alerts firewall exception must be enabled on the remote computer. In addition, members of the Performance Log Users group must also be members of the Event Log Readers group on the remote computer
Creating Data Collection Sets
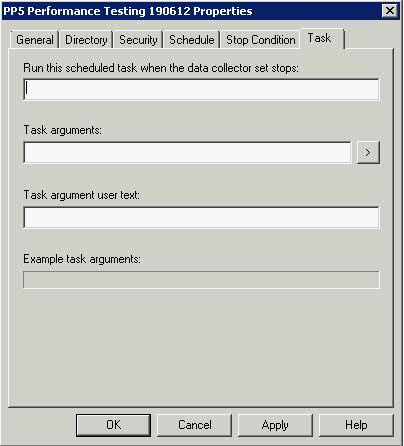
A Data Collector Set is the building block of performance monitoring and reporting in Windows Performance Monitor. It organizes multiple data collection points into a single component that can be used to review or log performance. A Data Collector Set can be created and then recorded individually, grouped with other Data Collector Set and incorporated into logs, viewed in Performance Monitor, configured to generate alerts when thresholds are reached, or used by other non-Microsoft applications. It can be associated with rules of scheduling for data collection at specific times. Windows Management Interface (WMI) tasks can be configured to run upon the completion of Data Collector Set collection.
Data Collector Sets can contain the following types of data collectors:
- Performance counters
- Event trace data
- System configuration information (registry key values)
Real Time Example
- Start Performance Monitor
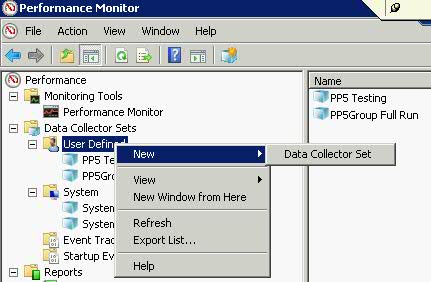
- Right-click anywhere in the Performance Monitor display pane, point to New, and click Data Collector Set. The Create New Data Collector Set Wizard starts. The Data Collector Set created will contain all of the data collectors selected in the current Performance Monitor view.

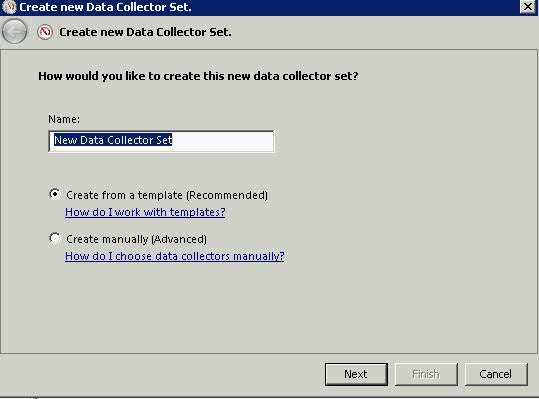
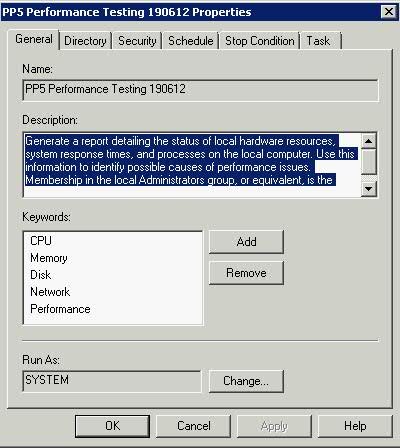
- Type in a name for your Data Collection Set and Choose from Template

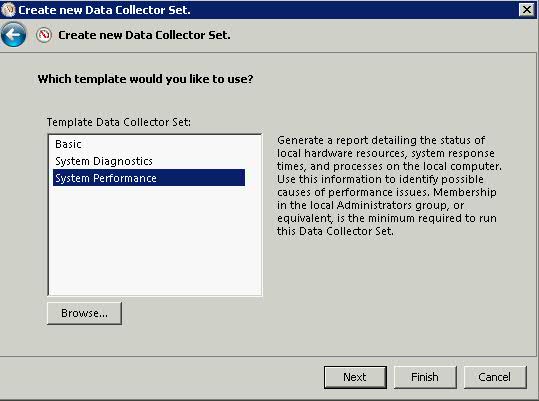
- Choose a Template (System Performance for this example)

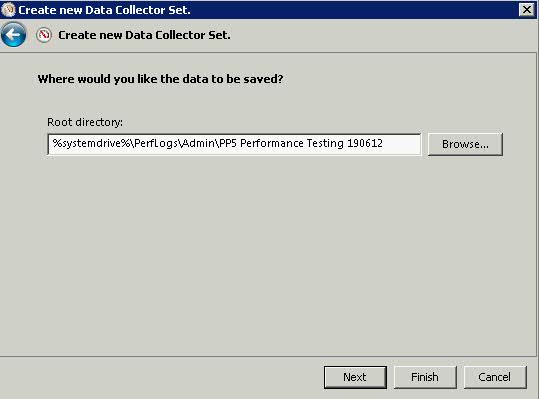
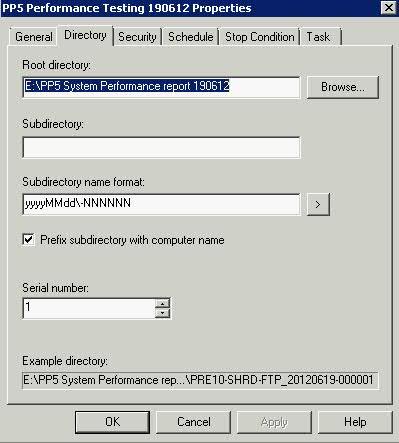
- Choose where the Data is going to be saved

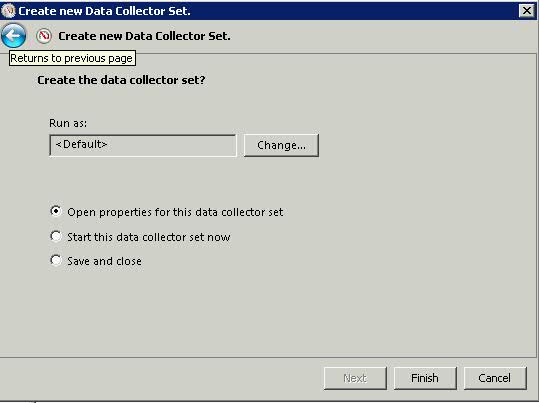
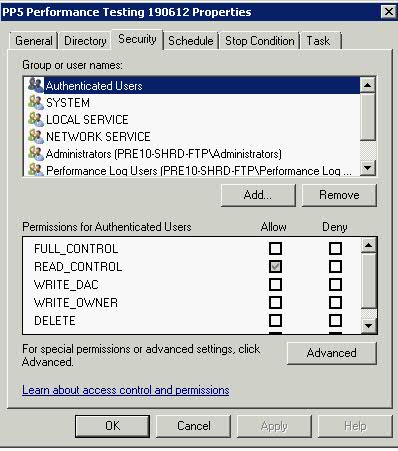
- Choose who to run this as. If you have permissions then this can be left as default. Choose to open the properties for this job


Reports
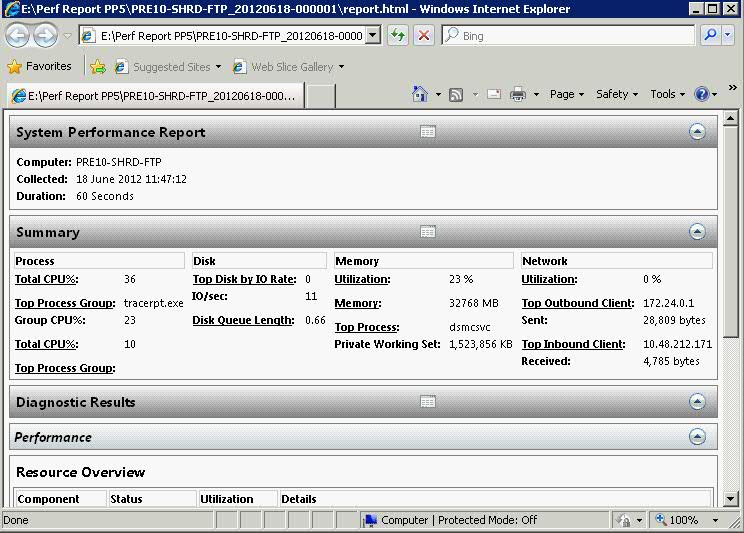
When this job has finished, Performance Monitor will reconcile a report to show the full history of this job.

Analysing the Results
Data Analysis
A tool that Microsoft support relies on to analyze Performance Monitor logs is the Performance Analysis of Logs (PAL) Tool. Clint Huffman, a Microsoft senior premier field engineer, wrote the 6,000-line VBScript tool, which is free and open source. PAL lets administrators easily analyze Performance Monitor logs without requiring them to be experts in performance counters or Windows architecture.
PAL contains a wizard-based UI that asks specific information about the system, which PAL passes as arguments to the VBScript program. PAL picks up where other log analyzers leave off, such as taking into account whether the system is 64-bit or 32-bit, whether the /3GB switch is used, and how much physical memory is installed—all variables that affect system performance. PAL uses these variables along with known thresholds, which were determined by engineers with years of experience, to determine the analysis that’s displayed. PAL provides a chronological order of alerts, so that you can correlate your system’s performance to any problems that you noticed at specific times.
Counters and Limits
http://technet.microsoft.com/en-us/library/cc768048.aspx
